
What’s the question?
A company that sells abroad is supposed to suffer when the dollar rises. Sales booked in euros or yen translate back into fewer dollars, reported revenue shrinks, and the share price follows. The reasoning appears in market commentary every time the dollar moves, usually applied to technology and industrials as blocks.
The claim describes individual companies, yet it is nearly always tested on sector indices. Foreign revenue exposure varies enormously inside a sector, so if the mechanism is real, two companies in the same sector at opposite ends of that range should respond very differently.
Dollar sensitivity here is a regression coefficient. Each stock’s daily returns are regressed on the market and on a dollar index, and the dollar coefficient is the dollar beta. A beta of -0.5 means a 1 percent rise in the dollar accompanies a 0.5 percent fall in the stock beyond whatever the market did that day. The market term is what makes the number interpretable: the dollar tends to rise on days when equities fall, so leaving it out turns a dollar beta into a market beta in disguise.
The approach
The universe is the S&P 500 as it stood on 1 September 2023, taken point-in-time and carried by entity id, so companies that later left the index stay in.
- Pull annual financials with geographic segment revenue, keeping companies whose reported United States line and remaining segments reconcile to total revenue. Foreign revenue share is one minus the United States share.
- Build a dollar index from five single-currency funds (FXE, FXY, FXB, FXC, FXF) weighted as the dollar index weights them, and negate the basket return.
- Compute daily returns from adjusted closes over the three years to 31 August 2026, using SPY as the market.
- Regress each stock’s returns on the market and the dollar index; the dollar coefficient is that company’s dollar beta.
- Regress dollar beta on foreign revenue share, once raw and once with sector fixed effects, and sort companies into foreign revenue quintiles.
Names without a complete price history for the window drop out, as do any whose daily returns fall outside a plausible range.
Code
import re
import pandas as pd
import statsmodels.api as sm
import xfinlink as xfl

xfl.set_api_key("YOUR_API_KEY")  # free at https://xfinlink.com/signup

AS_OF, START, END = "2023-09-01", "2023-08-25", "2026-08-31"
CCY = {"FXE": 0.60, "FXY": 0.14, "FXB": 0.12, "FXC": 0.10, "FXF": 0.04}
DOM = {("united", "states"), ("u", "s"), ("us",), ("usa",), ("domestic",),
       ("united", "states", "of", "america"), ("united", "states", "and", "territories")}

ids = sorted(xfl.index("sp500", as_of=AS_OF)["entity_id"].unique().tolist())
fund = pd.concat([xfl.fundamentals(entity_id=ids[i:i + 50], include_segments=True,
                                   period_type="annual", start="2023-09-01", end="2026-09-06")
                  for i in range(0, len(ids), 50)], ignore_index=True)
fund = fund[fund["segments_geographic"].apply(lambda v: isinstance(v, list) and len(v) > 0)]
fund = fund.sort_values("period_end").groupby("entity_id", as_index=False).last()

recs = []
for _, r in fund.iterrows():
    segs = [s for s in r["segments_geographic"]
            if s.get("is_primary") and s.get("value") is not None]
    total = sum(s["value"] for s in segs)
    dom = [s["value"] for s in segs
           if tuple(re.sub(r"[^a-z ]", " ", s["label"].lower()).split()) in DOM]
    if len(dom) == 1 and total and 0.98 <= total / r["revenue"] <= 1.02:
        recs.append(dict(entity_id=r["entity_id"], ticker=r["ticker"],
                         sector=r["gics_sector"], foreign_share=1 - dom[0] / total))
seg = pd.DataFrame(recs)

mp = xfl.prices(list(CCY) + ["SPY"], start=START, end=END, fields=["adj_close"])
mp = mp.pivot_table(index="date", columns="ticker", values="adj_close").dropna()
mr = mp.pct_change(fill_method=None).dropna()
mr["USD"] = -sum(w * mr[t] for t, w in CCY.items())

sids = sorted(seg["entity_id"].tolist())
px = pd.concat([xfl.prices(entity_id=sids[i:i + 40], start=START, end=END, fields=["adj_close"])
                for i in range(0, len(sids), 40)], ignore_index=True)
rets = px.pivot_table(index="date", columns="ticker", values="adj_close")
rets = rets.reindex(mr.index).pct_change(fill_method=None)

X2, X1 = sm.add_constant(mr[["SPY", "USD"]]), sm.add_constant(mr[["USD"]])
rows = []
for t in rets.columns:
    s = rets[t]
    if s.notna().sum() < 0.95 * len(mr) or s.max() > 1.0 or s.min() < -0.5:
        continue
    m = s.notna()
    f2 = sm.OLS(s[m], X2[m]).fit()
    rows.append(dict(ticker=t, mkt_beta=f2.params["SPY"], usd_beta=f2.params["USD"],
                     raw_usd_beta=sm.OLS(s[m], X1[m]).fit().params["USD"]))
df = seg.merge(pd.DataFrame(rows), on="ticker")

print(f"{len(df)} companies; mean dollar beta {df['usd_beta'].mean():+.3f}, "
      f"{(df['usd_beta'] < 0).sum()} negative")

D = pd.get_dummies(df["sector"], drop_first=True, dtype=float)
for label, dep, Z in [("dollar beta ~ foreign share", "usd_beta", df[["foreign_share"]]),
                      ("+ sector fixed effects", "usd_beta",
                       pd.concat([df[["foreign_share"]], D], axis=1)),
                      ("no market control", "raw_usd_beta", df[["foreign_share"]]),
                      ("market beta ~ foreign share", "mkt_beta", df[["foreign_share"]])]:
    f = sm.OLS(df[dep], sm.add_constant(Z)).fit()
    print("%-30s coef %7.4f  t %6.2f  R2 %.3f" % (label, f.params["foreign_share"],
                                                  f.tvalues["foreign_share"], f.rsquared))

df["q"] = pd.qcut(df["foreign_share"], 5, labels=[1, 2, 3, 4, 5])
print(df.groupby("q", observed=True)[["foreign_share", "usd_beta", "mkt_beta"]].mean().round(3))
Full script with formatting and visualisation: foreign-revenue-dollar-beta-python.py
Output
=== Foreign Revenue Share and Firm-Level Dollar Beta ===
S&P 500 roster as of 2023-09-01: 500 entities
Companies reporting a United States revenue line that reconciles to total revenue: 157
Dollar index: 754 daily observations, 6.4% annualised volatility, cumulative -5.1%
Names without a complete price history for the window: 11; outside the return screen: 1

Final sample: 145 companies, 737-753 daily observations each
Dollar beta: mean -0.205, median -0.155, sd 0.401
Negative dollar beta: 97 of 145 companies; individually significant at 5 percent: 52
Foreign revenue share: mean 41.8%, range 0.0% to 96.5%

specification                       coef   t-stat        p      R2
dollar beta ~ foreign share      -0.0443    -0.29    0.769   0.001
+ sector fixed effects           -0.1498    -0.92    0.357   0.162
no market control                -0.2320    -1.54    0.126   0.016
market beta ~ foreign share       1.0519     6.25    0.000   0.215

Pearson correlation -0.025, Spearman -0.035

quintile   n  foreign share  dollar beta  market beta
    1     29          10.0%       -0.190         0.56
    2     29          29.1%       -0.188         0.77
    3     29          42.5%       -0.209         0.96
    4     29          54.8%       -0.281         1.01
    5     29          72.6%       -0.155         1.25

Q5 minus Q1 dollar beta: +0.035  t = 0.31  p = 0.759
What this tells us
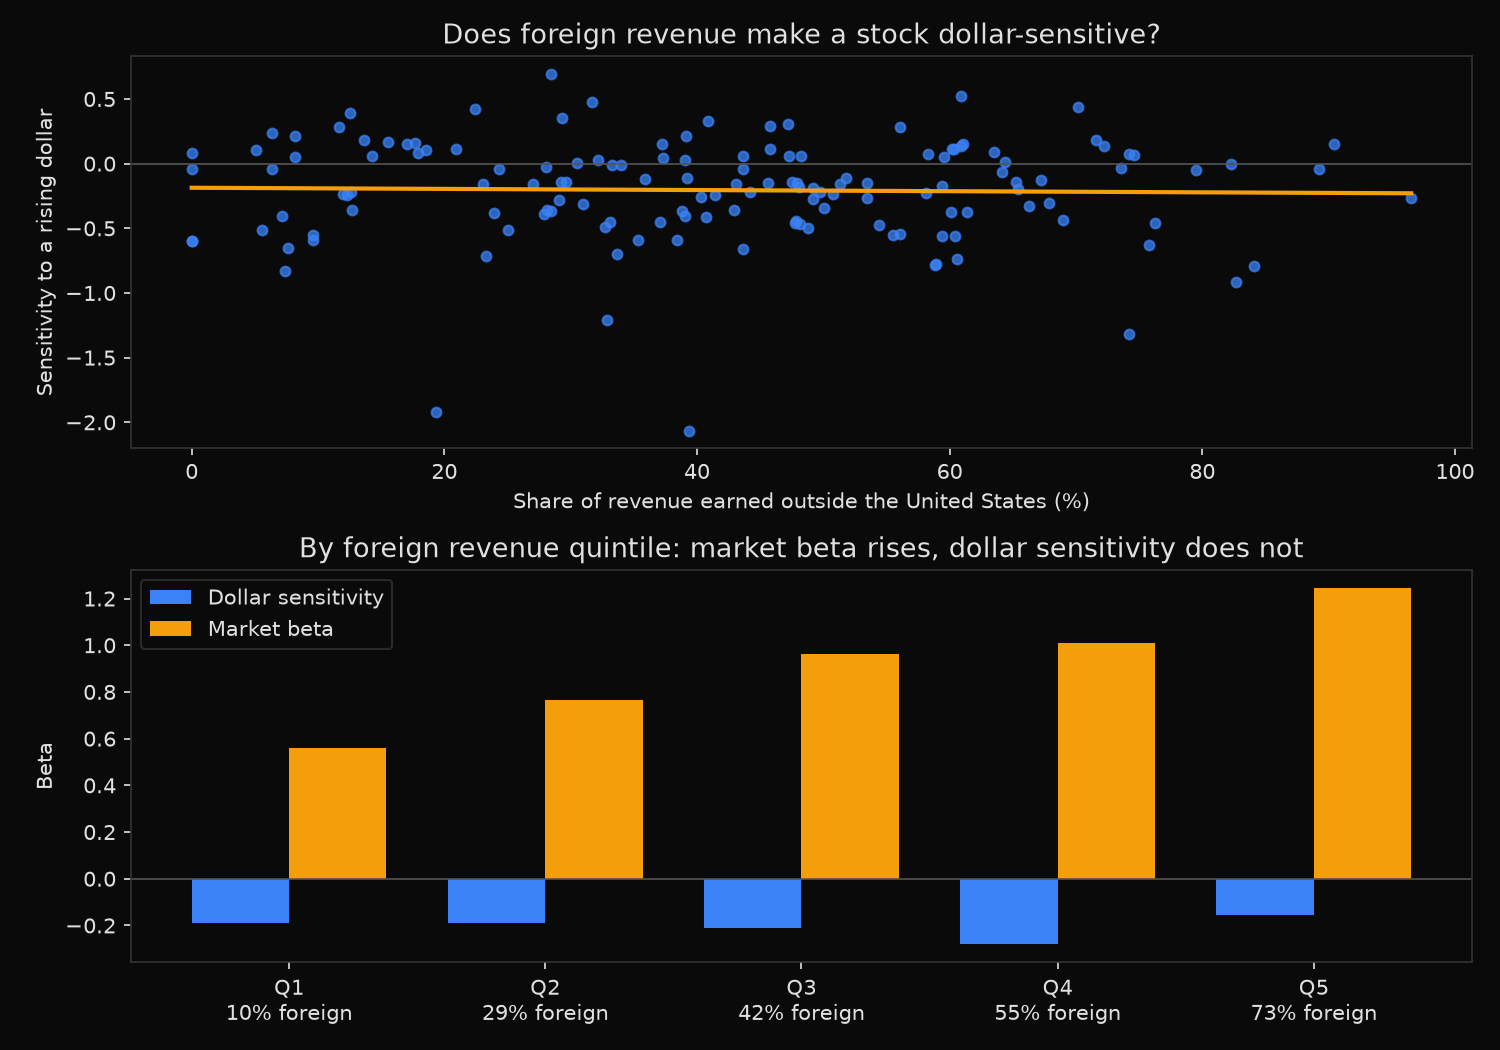
Dollar sensitivity is real and widespread. Holding the market fixed, the average company carries a dollar beta of -0.205, 97 of 145 are negative, and 52 clear conventional significance on their own returns.
Foreign revenue share explains none of it. The cross-sectional coefficient is -0.0443, t-statistic -0.29, R-squared 0.001, with a rank correlation of -0.035. Sector fixed effects move it to -0.1498 and the t-statistic to -0.92, still nowhere near significance. The quintile means make the point without a regression: -0.190, -0.188, -0.209, -0.281, -0.155 from the least to the most internationally exposed group. The top-minus-bottom gap of +0.035 carries a t-statistic of 0.31, and its sign is the opposite of what the translation story predicts.
The last row shows what foreign revenue share does predict. Against market beta the coefficient is +1.0519, t-statistic 6.25, R-squared 0.215. Average market beta climbs from 0.56 in the most domestic quintile to 1.25 in the most international one, because companies selling heavily abroad are semiconductor, capital goods and materials businesses, and those are high-beta cyclicals for reasons unrelated to currency.
That is why the exporter story looks convincing at index level. Drop the market control and the dollar coefficient strengthens to -0.2320, t-statistic -1.54, roughly five times the controlled estimate. The dollar rises when risk appetite falls, high-beta stocks fall hardest, and the high-beta stocks happen to be the international ones; a sector-level test reads that as currency exposure.
Translation reaches reported revenue a quarter or more later, while a dollar beta measures same-day moves; large foreign sellers also hedge and hold costs in the currencies they bill in.
So what?
Foreign revenue share is not a currency hedge ratio, and an FX overlay built from it will hedge the wrong exposure. Tilting away from high-foreign-revenue names ahead of an expected dollar rally is really a tilt away from high-beta cyclicals; that trade may work for the market reason rather than the currency one, and it fails whenever the dollar rises in a risk-on market.
Measure the exposure directly instead. The two-factor regression takes one price pull, produces a dollar beta per name, and separates the currency channel from the market channel that contaminates it. Every beta here comes from the same 754 trading days, so the numbers compare across companies in a way that reported revenue mix does not.
The same caution applies to any fundamental characteristic used as a factor proxy. A structural number lifted from a filing is not a factor loading; where the loading can be estimated from returns, estimate it. A macro factor beta study tabulates fund loadings on growth and inflation factors, estimated from returns in the same way.
Built with xfinlink — free financial data API for Python.