BLOG

Behind the numbers.

Code examples, market analysis, and data quality deep-dives.

Is AI Capex Paying Back Fast Enough? Revenue Hurdle Forecasting in Python
Could Shorter AI Asset Lives Hit Earnings? Depreciation Stress Test in Python
How Much AI Capex Risk Can a Portfolio Remove? Constrained Optimization in Python
Is the AI Capex Trade Crowded? Rolling Volatility and Sector Rotation in Python
Did the AI Boom Come From Existing S&P 500 Members? Point-in-Time Momentum Test in Python
Is AI Revenue Circular? Customer-Vendor Capex Loop Analysis in Python
Is the AI Trade Connected to Private Credit? Rolling Correlation Network in Python
Is Apollo More Balance-Sheet Sensitive Than Peers? Leverage Screen in Python
Are AI Earnings Supported by Cash Flow? Accrual and Capex Screen in Python
Can Defensive Stocks Hedge AI Drawdowns? Basket Regime Test in Python
How Fast Does the Market Price In Fed Decisions? FOMC Event Study in Python
How Much Are Options Sellers Overpaid? The Variance Risk Premium in Python
Which Companies Have the Worst Earnings Quality? Sloan Accrual Screen with Geographic Revenue Data in Python
Does the Oil-to-Gold Ratio Signal Recessions? XLE/GLD Backtest in Python
Is AI Spending Crowding Out Free Cash Flow? Capex Sustainability Across the Mag 7 in Python
Does a Long Energy / Short Bonds Portfolio Capture Inflation Surprises? Factor Construction in Python
Can a Hidden Markov Model Detect Oil Market Regimes? HMM Analysis in Python
Do Grain Prices Predict Food Inflation? Granger Causality Test in Python
Does the Corporate Credit Spread Predict Stock Market Crashes? BAA-AAA Spread Analysis in Python
Do Oil Stocks Hedge Inflation? Rolling Beta Analysis in Python
Which Stocks Are Most Rate-Sensitive? Equity Duration via Bond Beta in Python
Which Companies Have the Highest Accrual Ratios? Earnings Quality Screening in Python
Is Alpha Persistent or Decaying? Rolling Sharpe Ratio Analysis in Python
Are Markets Trending or Mean-Reverting? Hurst Exponent Analysis in Python
Is Consumer Discretionary vs Staples a Leading Indicator? XLY/XLP Ratio Analysis in Python
Does Heavy Capex Predict Future Stock Returns? Capital Expenditure Analysis in Python
How to Estimate Cost of Equity Using CAPM in Python
Is Volatility Predictable? Testing for Volatility Clustering in Python
Which Industrials Are Overleveraged? Net Debt to EBITDA Screening in Python
GM Before and After Bankruptcy: Why Entity Resolution Matters for Financial Data
What Is Adjusted Beta? Merrill Lynch Beta Shrinkage in Python
How Good Is a Stock Pick? Information Ratio and Tracking Error in Python
Do Stock Returns Follow a Normal Distribution? Testing for Fat Tails in Python
Which Large Caps Have the Highest Free Cash Flow Yield? FCF Screening in Python
Which Sectors Won Over 5 Years? Sector Rotation Analysis in Python
How to Forecast Stock Volatility with GARCH Models in Python
Are Stock Prices Mean-Reverting? Augmented Dickey-Fuller Test in Python
How to Calculate CAPM Alpha and Beta with Regression in Python
How to Compare Sector Sharpe Ratios and Sortino Ratios in Python
DELL: Why Stitching Historical Price Data Together Is Wrong
How to Analyze Drawdown and Recovery for Bank Stocks in Python
How to Screen SaaS Stocks by Revenue Growth and Cash Flow in Python
How to Screen REITs by Dividend Yield and Valuation in Python
How Correlated Are the Magnificent 7? Intra-Group Correlation in Python
AAPL vs XOM: Do Individual Stocks Have Seasonal Patterns?
How to Rank Large-Cap Stocks by Momentum in Python
How to Build a Multi-Endpoint Financial Dashboard in Python
How to Compare Volatility Across Energy Stocks in Python
How to Screen Healthcare Stocks by Valuation in Python
How to Build a Sector Correlation Matrix for Portfolio Diversification in Python
How to Find Oversold and Overbought Stocks Using Z-Scores in Python
How to Measure Earnings Quality: Cash Flow vs Net Income in Python
How to Build a Multi-Factor Stock Screen in Python (Value + Momentum + Quality)
How to Build a Simple DCF Model for Any Stock in Python
How to Screen Tech Stocks by Revenue Growth in Python
How to Screen Stocks by Balance Sheet Health in Python
Is "Sell in May" Real? SPY Monthly Seasonality Over 10 Years
How to Compare Sector Performance YTD Using Python
How to Track S&P 500 Additions and Removals Over Time in Python
How to Screen Dividend Stocks by Yield and Quality in Python
How to Calculate Max Drawdown and Recovery Time for Any Stock in Python
How to Compare Profitability Across Mega-Cap Tech Stocks in Python
Why Ticker Symbols Are Unreliable: The Recycling Problem Every Quant Should Know
How to Calculate and Compare Stock Volatility in Python
How to Screen Blue-Chip Stocks by P/E Ratio in Python
How to Track Companies Through Ticker Changes, Bankruptcies, and Renames in Python
S&P 500 Turnover: How Much the Index Has Changed Since 2010
How to Calculate Stock Beta and Correlation in Python
← All articles

Can Defensive Stocks Hedge AI Drawdowns? Basket Regime Test in Python

What's the question?

AI exposure has become a large part of many growth portfolios. The risk is concentration. If the same stocks drive return, momentum, earnings revisions, and index weight, a single drawdown can affect portfolios that appear diversified on paper.

A defensive hedge should do two things during stress: lose less than the growth basket and ideally hold up better than the broad market. Defensive stocks are companies whose products are less sensitive to the economic cycle, such as household staples, beverages, healthcare, discount retail, and restaurants. They are not risk-free. The question is whether they have recently provided useful protection during AI-led selloffs.

The approach

The AI basket is NVDA, MSFT, ORCL, AMZN, and META. The defensive basket is PG, JNJ, KO, WMT, and MCD. SPY is the market benchmark.

The test uses monthly returns because hedge decisions are usually made at portfolio-rebalancing frequency, not daily noise frequency. AI stress months are defined as the bottom decile of AI basket monthly returns. This avoids choosing an arbitrary crisis date and lets the data define the worst AI regimes.

Although five years of prices are requested, the complete common panel begins in July 2022 after requiring every ticker to have data in the same monthly return series. The output reports the actual sample used.

The analysis then compares average monthly returns for the AI basket, defensive basket, and SPY during stress months and all other months.

Code

import xfinlink as xfl
import pandas as pd

xfl.set_api_key("YOUR_API_KEY")  # free at https://xfinlink.com/signup

ai = ["NVDA", "MSFT", "ORCL", "AMZN", "META"]
defensive = ["PG", "JNJ", "KO", "WMT", "MCD"]
tickers = ai + defensive + ["SPY"]

df = xfl.prices(tickers, period="5y", fields=["close"])
prices = df.pivot_table(index="date", columns="ticker", values="close").dropna()

monthly = prices.resample("ME").last().pct_change().dropna()
monthly["AI basket"] = monthly[ai].mean(axis=1)
monthly["Defensive basket"] = monthly[defensive].mean(axis=1)
monthly["SPY"] = monthly["SPY"]

threshold = monthly["AI basket"].quantile(0.10)
stress = monthly[monthly["AI basket"] <= threshold]

print(stress[["AI basket", "Defensive basket", "SPY"]].mean())

Full script with formatting and visualisation: defensive-stocks-ai-drawdown-hedge-python.py

Output

Defensive stock basket returns during AI stress months compared with other months
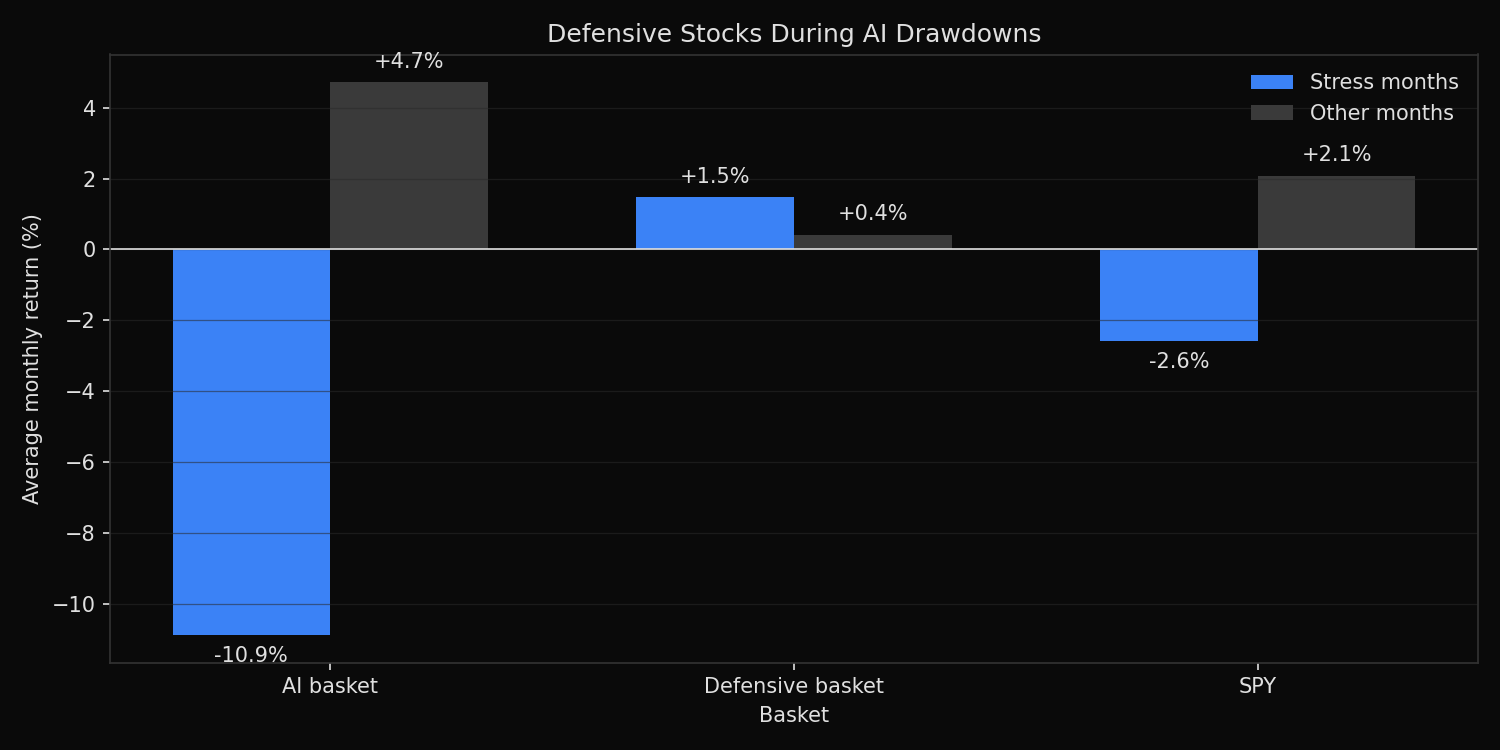
=== Defensive Stocks During AI Drawdowns ===
Sample: 2022-07 to 2026-05
AI stress threshold (bottom decile): -7.7%
Stress months: 5 of 47

Average monthly returns:
AI basket, stress months:        -10.9%
Defensive basket, stress months: +1.5%
SPY, stress months:              -2.6%
Protection spread:               +12.4%

Defensive basket beat AI in 100% of stress months
Defensive basket beat SPY in 80% of stress months
Worst AI month: 2022-09  AI=-15.1%  Defensive=-5.4%  SPY=-9.6%

What this tells us

The defensive basket worked in the recent sample. During the bottom decile of AI basket returns, AI stocks fell 10.9% on average. The defensive basket gained 1.5% on average. SPY fell 2.6%. The protection spread between defensive stocks and the AI basket was 12.4 percentage points.

The hit rate is also strong. The defensive basket beat the AI basket in 100% of stress months and beat SPY in 80% of stress months. The worst AI month was September 2022, when the AI basket fell 15.1%. Defensive stocks still fell 5.4%, but they lost much less than both the AI basket and SPY.

The test does not mean defensive stocks always hedge growth risk. It shows that in this recent AI-heavy market regime, a simple equal-weight basket of defensive companies has provided material drawdown protection when AI exposure was under pressure.

So what?

Defensive stocks are a practical hedge for AI concentration risk, but they are not a perfect hedge. They reduce drawdowns by changing the economic exposure of the portfolio. They do not offset losses mechanically like a put option or short position.

For portfolio construction, the result supports a barbell approach: keep AI exposure where fundamentals justify it, but pair it with companies whose cash flows are less tied to the AI spending cycle. The hedge should be sized against stress-month behavior, not average full-period volatility. In this sample, the defensive basket earned its place because it helped exactly when AI exposure hurt.

Built with xfinlink — free financial data API for Python. pip install xfinlink

Built with xfinlink — free financial data API for Python. pip install xfinlink
← All articles