

How Concentrated Are Institutional Equity Portfolios? Form 13F Concentration Analysis in Python
July 28, 2026
What’s the question?
Portfolio concentration is the share of a portfolio’s value sitting in its largest holdings. Two measures carry most of the work. The top-ten weight is the fraction of value held in the ten biggest positions. The Herfindahl-Hirschman index sums the squared weight of every position, and its reciprocal is the effective number of positions: the count of equally weighted holdings that would produce the same concentration. A 4,000-stock portfolio with an effective number of 76 carries the single-name risk of a 76-stock portfolio.
Institutional portfolios in the United States are more concentrated than they were a decade ago. Two explanations compete. Either managers chose to make larger bets on fewer companies, or the market itself concentrated and portfolios that track it inherited the result without anyone deciding anything.
Index funds separate the two. Their weights are market weights by construction, and the people running them exercise no discretion over position size. Whatever concentration an index tracker reports is a measurement of the market, not a decision.
The approach
Every institution managing more than $100 million in US-listed equities files a quarterly Form 13F with the SEC listing its positions and their reported value. Built from SEC EDGAR public filings and market data.
The sample is eight large filers in two groups. Vanguard, BlackRock, State Street and Geode run predominantly index-tracking books. Fidelity, Wellington, Capital Research Global Investors and Berkshire Hathaway select positions. Berkshire sits in the sample as the far end of the concentration scale rather than as a typical manager.
- Resolve each firm to a manager identifier with
xfl.managers(). - Pull the reported portfolio at 30 June of every year from 2011 to 2025, giving 15 snapshots per firm and 120 portfolio-quarters in total.
- Aggregate securities to issuers on
entity_id. A manager holding both Alphabet share classes holds one company, and issuer-level weights are what concentration means economically. - Compute the top-ten weight and the effective number of positions from those issuer weights.
Common stock lines only; option lines are set aside.
Code
import pandas as pd
import xfinlink as xfl

xfl.set_api_key("YOUR_API_KEY")  # free at https://xfinlink.com/signup

MANAGERS = {
    "Vanguard":        ("vanguard group", "VANGUARD GROUP INC", "index"),
    "BlackRock":       ("blackrock inc", "BLACKROCK INC", "index"),
    "State Street":    ("state street", "STATE STREET CORP", "index"),
    "Geode":           ("geode", "GEODE CAPITAL MANAGEMENT, LLC", "index"),
    "Fidelity":        ("fmr", "FMR LLC", "stock picker"),
    "Wellington":      ("wellington management", "WELLINGTON MANAGEMENT GROUP LLP", "stock picker"),
    "Capital Research": ("capital research", "Capital Research Global Investors", "stock picker"),
    "Berkshire":       ("berkshire hathaway", "Berkshire Hathaway Inc", "stock picker"),
}
QUARTERS = [f"{y}-06-30" for y in range(2011, 2026)]

ids = {}
for display, (term, exact, _style) in MANAGERS.items():
    found = xfl.managers(search=term)
    ids[display] = int(found[found["manager_name"] == exact]["manager_id"].iloc[0])

def concentration(df):
    eq = df[df["put_call"].isna()]              # common stock, not option lines
    # One issuer can be held through several securities (two Alphabet classes,
    # two Berkshire classes). Group on entity_id, never on ticker.
    value = eq.groupby("entity_id")["value_usd"].sum().sort_values(ascending=False)
    w = value / value.sum()
    hhi = float((w ** 2).sum())
    return dict(issuers=len(w), total_usd=float(value.sum()),
                top1=float(w.iloc[0]), top10=float(w.head(10).sum()),
                hhi=hhi * 10000, eff_n=1.0 / hhi)

rows = []
for display, mid in ids.items():
    for q in QUARTERS:
        df = xfl.manager_holdings(manager_id=mid, quarter=q, max_rows=20000)
        rows.append(dict(manager=display, style=MANAGERS[display][2],
                         year=int(q[:4]), **concentration(df)))

panel = pd.DataFrame(rows)
top10 = panel.pivot(index="year", columns="manager", values="top10")
effn = panel.pivot(index="year", columns="manager", values="eff_n")
print((top10 * 100).round(1))
print(effn.round(1))
Full script with formatting and visualisation: institutional-13f-portfolio-concentration-python.py
Output
Reported Form 13F portfolios, 30 June 2011-2025, issuer-level weights
Managers: 8   quarters: 15   portfolio-quarters: 120

SIZE AND BREADTH AT 2025-06-30
manager           style          issuers  reported $bn   largest position
Vanguard          index             3988         6,098               5.8%
BlackRock         index             4284         5,060               5.8%
State Street      index             3832         2,646               5.8%
Geode             index             4127         1,421               6.4%
Fidelity          stock picker      4667         1,715               9.2%
Wellington        stock picker      1707           543               4.9%
Capital Research  stock picker       409           497               7.2%
Berkshire         stock picker        36           256              22.4%

TOP-TEN WEIGHT (% of reported portfolio value)
year      Vanguard    BlackRock State Street        Geode     Fidelity   Wellington Capital Rese    Berkshire
 2011        15.1%        13.6%        18.0%        19.3%        13.2%        15.4%        24.1%        96.0%
 2012        17.1%        15.9%        19.5%        21.5%        15.9%        17.9%        27.4%        91.9%
 2013        14.5%        14.2%        16.7%        17.1%        11.9%        16.9%        26.8%        85.4%
 2014        13.8%        13.6%        16.0%        16.3%        13.1%        16.8%        27.7%        84.1%
 2015        13.3%        13.5%        15.5%        15.9%        14.2%        18.2%        26.4%        80.9%
 2016        13.2%        13.4%        15.4%        15.8%        15.0%        17.8%        26.1%        84.8%
 2017        13.8%        13.8%        15.9%        16.4%        18.0%        15.3%        25.0%        79.9%
 2018        15.0%        15.0%        17.0%        17.8%        21.2%        14.4%        26.9%        82.0%
 2019        15.5%        15.2%        17.4%        17.6%        22.6%        14.9%        27.8%        80.9%
 2020        20.0%        19.8%        21.7%        22.8%        28.3%        18.0%        34.6%        88.0%
 2021        19.6%        19.1%        21.0%        22.2%        27.5%        17.4%        29.1%        87.5%
 2022        20.1%        19.9%        21.1%        22.7%        26.5%        18.2%        28.9%        87.7%
 2023        23.0%        22.7%        23.5%        26.1%        30.2%        20.2%        28.6%        91.4%
 2024        28.1%        27.9%        28.1%        31.1%        36.4%        23.8%        33.7%        90.8%
 2025        29.0%        28.9%        29.2%        31.9%        37.2%        25.8%        36.5%        87.7%

EFFECTIVE NUMBER OF POSITIONS (1 / sum of squared weights)
year      Vanguard    BlackRock State Street        Geode     Fidelity   Wellington Capital Rese    Berkshire
 2011        211.7        243.5        153.8        135.6        227.6        184.4         88.4          6.8
 2012        175.7        196.6        137.1        114.3        147.5        159.3         78.5          6.7
 2013        222.8        228.2        170.5        164.8        262.8        167.1         81.5          8.0
 2014        236.5        243.5        180.8        181.1        241.7        170.7         79.9          8.4
 2015        242.8        238.8        182.3        179.3        216.8        148.7         80.9          8.7
 2016        250.1        243.2        186.2        187.3        216.9        149.0         82.4          8.3
 2017        244.9        244.5        183.2        183.3        174.6        173.6         85.7         10.4
 2018        225.4        225.6        174.0        169.2        138.9        200.5         76.8          9.0
 2019        204.0        210.8        164.2        163.4        124.8        181.1         75.4          9.3
 2020        128.5        135.9        110.3        102.9         84.2        140.3         57.3          4.4
 2021        140.8        153.8        123.0        115.0         93.0        159.6         70.2          4.7
 2022        127.3        136.1        116.8        102.2         93.9        139.7         67.2          5.0
 2023         99.2        106.3         94.4         81.0         73.7        129.4         67.3          3.5
 2024         78.5         81.6         76.2         65.5         49.5        106.3         54.0          6.7
 2025         76.0         77.4         74.0         64.1         46.3         94.0         49.5          8.1

CHANGE 2011 -> 2025
manager            top-10 2011  top-10 2025    change  eff. N 2011  eff. N 2025
Vanguard                 15.1%        29.0%    +13.9        211.7         76.0
BlackRock                13.6%        28.9%    +15.2        243.5         77.4
State Street             18.0%        29.2%    +11.1        153.8         74.0
Geode                    19.3%        31.9%    +12.6        135.6         64.1
Fidelity                 13.2%        37.2%    +24.1        227.6         46.3
Wellington               15.4%        25.8%    +10.3        184.4         94.0
Capital Research         24.1%        36.5%    +12.4         88.4         49.5
Berkshire                96.0%        87.7%     -8.3          6.8          8.1

Group mean top-ten weight   index-tracking: 16.5% -> 29.7%   stock pickers: 37.2% -> 46.8%
Gap between the two groups: +20.6 pts in 2011, +17.0 pts in 2025
Stock pickers excluding Berkshire: 17.6% -> 33.1%
What this tells us
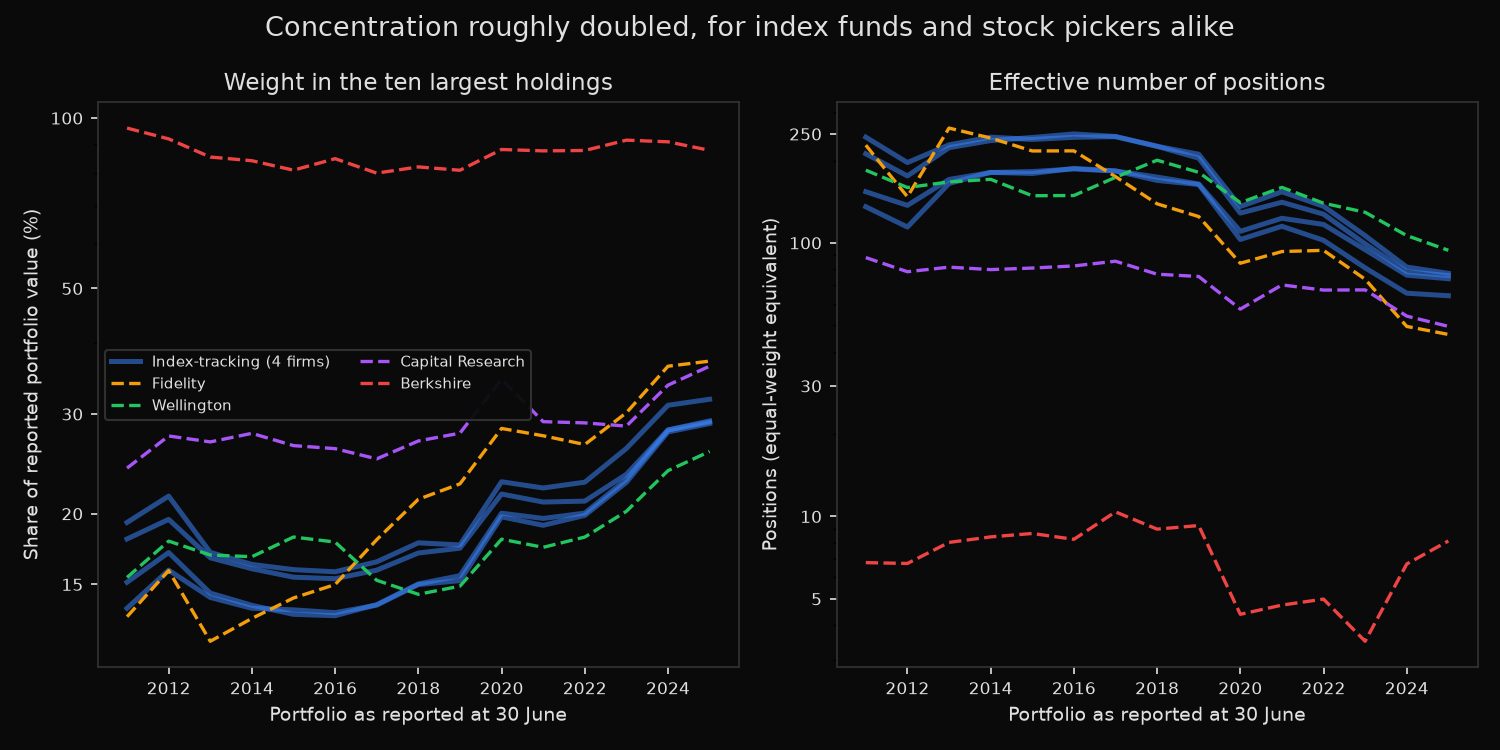
Every index tracker in the sample roughly doubled its top-ten weight: Vanguard from 15.1% to 29.0%, BlackRock from 13.6% to 28.9%, State Street from 18.0% to 29.2%, Geode from 19.3% to 31.9%. Nobody at those firms decided to concentrate. The weights are the market’s weights, so the doubling is a measurement of what happened to the US equity market between 2011 and 2025.
The effective number of positions falls harder than the top-ten weight rises, because it responds to the whole weight distribution rather than a cutoff at ten names. Vanguard reports 3,988 issuers at 30 June 2025 and an effective number of 76. In 2011 the same firm reported an effective number of 212. Two-thirds of the diversification is gone while the number of companies held barely moved.
The managers who could have leaned against this did not. Fidelity’s top-ten weight rose 24.1 points, the largest move in the sample, and its effective number of positions fell from 228 to 46, ending below every index tracker. Capital Research runs 409 issuers against Vanguard’s 3,988 and finishes at 36.5%. Wellington moved least, ending at 25.8% with 94 effective positions, the only manager here whose 2025 portfolio is measurably broader than the market itself.
Berkshire behaves as a control. Already at 96.0% in 2011, it finishes at 87.7% with 22.4% of reported value in a single name.
Most of the move arrives late. The index-tracking group sat between 13% and 19% from 2013 to 2019, then stepped up in 2020 and again across 2023 to 2025.
So what?
Concentration limits written as fixed thresholds have quietly changed meaning. A fund holding 30% in its top ten was running a distinctly concentrated book in 2015 and is running a market-weight book in 2025. Any mandate or risk limit that fixes a number should be restated as a difference against a total-market tracker in the same quarter.
The same restatement applies to manager selection. Wellington at 25.8% against an index-tracking mean of 29.7% is genuinely holding a broader portfolio; Fidelity at 37.2% is taking 7.5 points of concentration risk beyond the market.
For risk modelling, the effective number of positions is the figure to carry forward. A broad US equity index now behaves like 76 equally weighted stocks rather than the 212 of 2011, so diversification assumptions calibrated on the early 2010s overstate the number of independent bets by nearly a factor of three. Hedges sized against the older figure are too small.
Built with xfinlink — free financial data API for Python. pip install xfinlink
pip install xfinlink