
What’s the question?
Leases are borrowing under another name. A retailer that signs a fifteen-year store lease has committed to a stream of fixed payments it cannot walk away from, and that is what a loan is. Accounting kept those commitments off the balance sheet for decades, so anyone who cared had to rebuild them from a footnote.
The rules changed in 2019. Companies now report an operating lease liability on the balance sheet itself, split into a current and a non-current portion and measured as the present value of what they owe. The number sits in plain sight, but it does not sit inside the debt line. Total debt on a standard data feed means borrowings: notes, bonds, bank facilities. Lease obligations occupy separate rows, so a screen ranking companies on debt to EBITDA skips an obligation which, for some businesses, is larger than everything else they owe.
How much does that matter? If lease obligations were small next to borrowings, the omission would be a rounding error. If they are large and unevenly spread across industries, then a leverage ranking built on borrowings alone is sorting business models rather than balance sheets.
The approach
The sample starts from the current S&P 500 roster and takes each company’s most recent annual filing. Financials and Real Estate are excluded: leverage for a bank or a landlord is a different quantity, built differently and read differently.
- Pull revenue, EBITDA, total debt, the current maturity of long-term debt, and both halves of the operating lease liability.
- Require an EBITDA margin of at least 5 percent. A company earning close to nothing on a large revenue base produces a leverage figure driven entirely by its denominator.
- Compute debt to EBITDA on borrowings alone, then again with the two lease liability rows added to the numerator.
- Repeat both calculations with the current maturity of long-term debt folded into borrowings, and keep only findings that survive under either definition.
Step 4 exists because the current maturity of long-term debt is sometimes reported inside the long-term figure and sometimes beside it, so one definition of borrowings would leave individual companies sensitive to a reporting convention. 308 companies clear every screen.
Code
import pandas as pd
import xfinlink as xfl

xfl.set_api_key("YOUR_API_KEY")  # free at https://xfinlink.com/signup

FIELDS = ["revenue", "ebitda", "total_debt", "current_portion_long_term_debt",
          "operating_lease_liabilities_current",
          "operating_lease_liabilities_noncurrent"]

ids = xfl.index("sp500")["entity_id"].dropna().astype(int).tolist()
f = pd.concat([xfl.fundamentals(entity_id=ids[i:i + 100], period_type="annual",
                                start="2024-09-01", fields=FIELDS)
               for i in range(0, len(ids), 100)], ignore_index=True)

f = f.sort_values("period_end").groupby("entity_id", as_index=False).tail(1)
f = f[~f["gics_sector"].isin(["Financials", "Real Estate"])]
f = f.dropna(subset=["ebitda", "total_debt",
                     "operating_lease_liabilities_current",
                     "operating_lease_liabilities_noncurrent"])
f = f[(f["ebitda"] / f["revenue"]) >= 0.05].copy()

f["lease"] = (f["operating_lease_liabilities_current"]
              + f["operating_lease_liabilities_noncurrent"])
f["reported"] = f["total_debt"] / f["ebitda"]
f["adjusted"] = (f["total_debt"] + f["lease"]) / f["ebitda"]
f["delta"] = f["adjusted"] - f["reported"]

print(f["delta"].median(), (f["lease"] > f["total_debt"]).sum())
print(f.groupby("gics_sector")["delta"].median().sort_values(ascending=False))
Full script with formatting and visualisation: operating-lease-hidden-leverage-python.py
Output
Companies in sample: 308
Median reported debt/EBITDA:        2.38x
Median lease-adjusted debt/EBITDA:  2.66x
Median increase:                    0.15 turns
Gain 1.00 turns or more:            22 companies
Owe more in leases than borrowings: 26 companies

Cross 3.0x once leases count (either debt definition): 13
DG, DLTR, FDX, HCA, HII, HRL, IR, LUV, MDT, SHW, TMUS, TSCO, UAL

Sector medians:
                         n  reported  adjusted  lease_share  delta
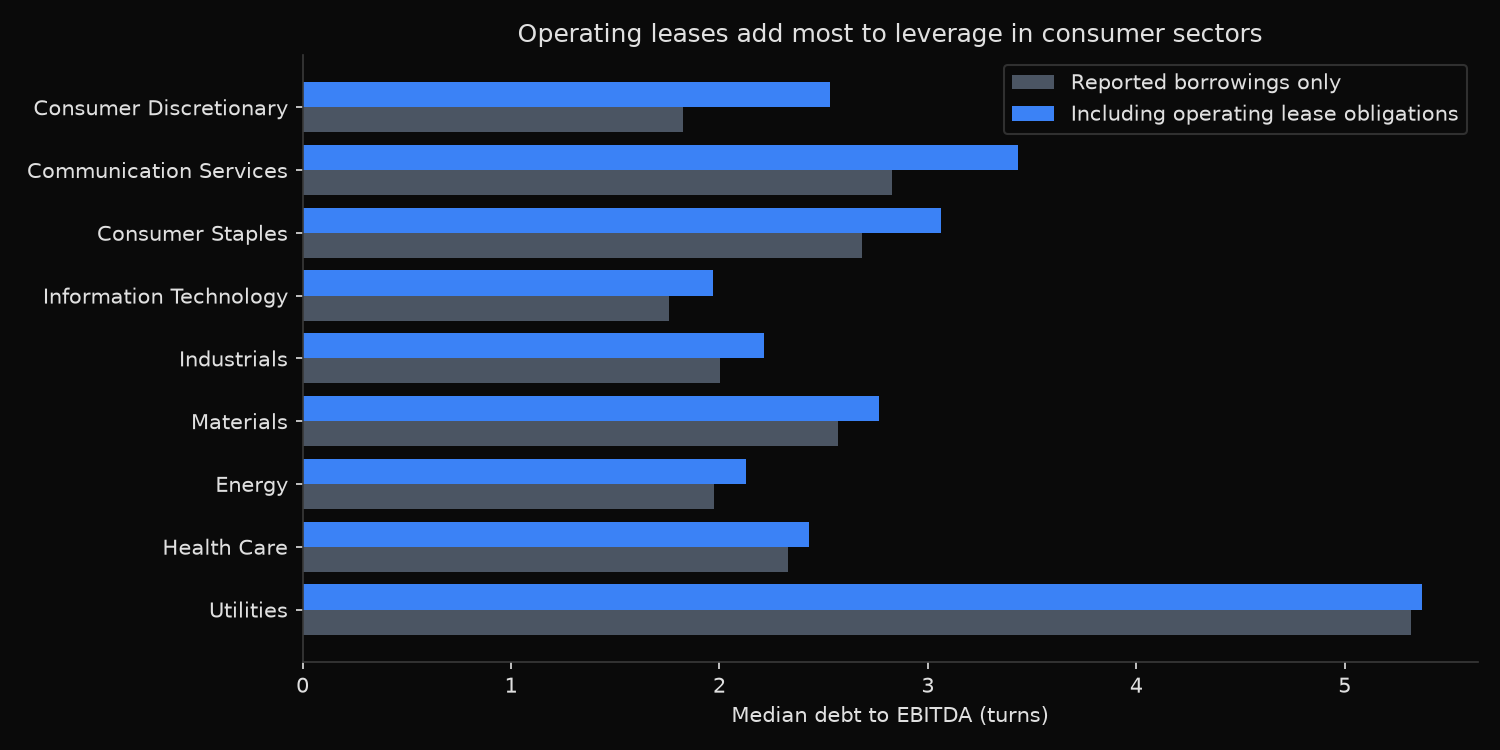
Consumer Discretionary  38      1.83      2.53        28.37   0.71
Communication Services  15      2.83      3.43        14.37   0.60
Consumer Staples        23      2.68      3.06         5.98   0.38
Information Technology  63      1.76      1.97         7.62   0.21
Industrials             67      2.00      2.21         7.50   0.21
Materials               22      2.57      2.77         6.91   0.20
Energy                  14      1.97      2.13         3.75   0.15
Health Care             40      2.33      2.43         5.30   0.10
Utilities               26      5.32      5.37         1.09   0.05

Largest increases:
ticker            gics_sector  borrowings    lease  reported  adjusted  delta  lease_share
   MGM Consumer Discretionary     6260.33 25068.75      3.10     15.51  12.41        80.02
    DG       Consumer Staples     9214.55 11138.37      2.84      6.26   3.43        54.73
  SBUX Consumer Discretionary    14685.20 10536.70      3.12      5.36   2.24        41.78
   CMG Consumer Discretionary        0.00  5075.81      0.00      2.21   2.21       100.00
  TSCO Consumer Discretionary     1764.97  4141.75      0.90      3.01   2.11        70.12
  DLTR       Consumer Staples     2431.70  4623.90      1.06      3.07   2.01        65.54
   DRI Consumer Discretionary     1653.10  3938.80      0.77      2.61   1.84        70.44
   PNW              Utilities     9962.68  3736.95      4.89      6.72   1.83        27.28
   FDX            Industrials    20113.00 16837.00      2.12      3.90   1.78        45.57
   BBY Consumer Discretionary     1170.00  2957.00      0.53      1.86   1.33        71.65
What this tells us
For most of the index the adjustment is small. The median company adds 0.15 turns of EBITDA once lease obligations count, which would not change how any credit committee sees it. (The two median ratios in the output block differ by 0.28; a median of differences is not a difference of medians.)
The average conceals the shape. 22 companies gain a full turn or more, and 26 owe more under their leases than they have borrowed. Sector medians separate by how much physical space a business occupies without owning it: Consumer Discretionary adds 0.71 turns against 0.05 for Utilities, a fourteenfold difference driven by store networks and restaurants on one side and rate-based generating assets on the other. Lease obligations are 28 percent of the combined obligation for the median consumer discretionary name and 1 percent for the median utility.
The individual cases are sharper than the medians. MGM Resorts reports 6.3 billion dollars of borrowings against 25.1 billion of lease obligations, the residue of selling its casino property and leasing it back, which moves its leverage from 3.1 to 15.5 turns. Chipotle carries no borrowings whatsoever and 5.1 billion dollars of lease obligations, so a debt screen records it at 0.00 turns while its fixed obligations run to 2.21. Tractor Supply reads 0.90 turns on borrowings and 3.01 with leases counted.
That last case is the practical one. 13 companies sit below 3.0 turns on borrowings and at or above 3.0 turns once leases are included, under either definition of borrowings. Covenant thresholds and screening cutoffs cluster at round numbers like that.
So what?
Add the two operating lease liability rows to the numerator whenever leverage is being compared across companies that do not share a business model. The adjustment costs one line of code and it is the difference between comparing balance sheets and comparing real estate strategies.
The comparison matters most where the ranking drives a decision. A credit screen filtering at 3.0 turns will admit a specialist retailer whose fixed obligations are half again as large as the borrowings it reports, while a utility passes or fails the same test on borrowings that already tell the whole story. Any distress signal built on the unadjusted ratio inherits that distortion.
One refinement is worth making where precision matters: finance lease liabilities, reported in their own rows, belong in the numerator on the same argument as operating leases.
Built with xfinlink — free financial data API for Python.