
What’s the question?
A trailing stop is a standing instruction to sell a position once it falls a fixed percentage below the highest level it has reached since purchase. The pitch is insurance: a small, known cost buys protection against the holding that never comes back.
That pitch omits the other half of the trade. Selling after a 20 percent decline does not undo the decline; it converts a paper loss into a realised one and hands the rebound to whoever bought the shares. Since most large-company drawdowns end in recovery rather than collapse, the rule pays out rarely and charges a premium on every position it touches. Both sides can be measured: the return given up on the names that recovered, and the damage avoided on the names that did not. A drawdown recovery analysis follows the recovery question across three decades of index members.
The approach
The universe is the S&P 500 as it stood on 2 January 2015, so the sample carries no survivorship bias: EMC, SanDisk and Precision Castparts are in it. Companies are carried by entity identifier rather than ticker, so a reassigned symbol cannot splice two price histories into one.
- Draw 100 of the 500 members at random with a fixed seed, then pull daily total returns from 2 January 2015 to 31 December 2024.
- Screen the panel. Names need 500 trading days from the start of the window, and any name with a daily total return above plus 100 percent or below minus 75 percent is set aside. That leaves 89 names and 210,308 daily observations, 11 of them measured to their last traded day because they cease trading first.
- Compound each name into a total-return index and sell at the close of the first day it sits 10, 15, 20 or 25 percent below its running peak.
- Run two exit rules. Rule A leaves the proceeds in cash earning nothing. Rule B buys back when the index regains the peak that triggered the sale, after which the stop re-arms.
Every figure below is conditional on that last choice, which is why both rules appear; costs, slippage and tax on a realised gain are excluded, so the measured cost is a floor.
Code
import numpy as np
import pandas as pd
import xfinlink as xfl

xfl.set_api_key("YOUR_API_KEY")  # free at https://xfinlink.com/signup

roster = xfl.index("sp500", as_of="2015-01-02")
ids = sorted(int(e) for e in roster["entity_id"].dropna())
sample = sorted(np.random.default_rng(20260902).choice(np.array(ids), 100, replace=False).tolist())

px = pd.concat([xfl.prices(entity_id=sample[i:i + 25], start="2015-01-02", end="2024-12-31",
                           fields=["close", "return_daily"], max_rows=200000)
                for i in range(0, len(sample), 25)], ignore_index=True)
px = px.drop_duplicates(["entity_id", "date"]).sort_values(["entity_id", "date"])


def run(P, thr, reenter):
    """Sell at the close of the day the drawdown from the running peak reaches thr."""
    w, invested, entry, peak, ref = 1.0, True, P[0], P[0], 0.0
    for t in range(1, len(P)):
        if invested:
            if P[t] > peak:
                peak = P[t]
            elif P[t] <= peak * (1.0 - thr):
                w *= P[t] / entry
                invested, ref = False, peak
        elif reenter and P[t] >= ref:
            invested, entry, peak = True, P[t], P[t]
    return w * (P[-1] / entry if invested else 1.0)


rows = []
for eid, d in px.groupby("entity_id"):
    P = np.cumprod(1.0 + d.sort_values("date")["return_daily"].fillna(0.0).to_numpy())
    rows.append({"ticker": d["ticker"].iloc[-1], "bh": P[-1] - 1.0,
                 **{f"stop{int(t * 100)}": run(P, t, False) - 1.0 for t in (0.10, 0.15, 0.20, 0.25)}})

res = pd.DataFrame(rows)
for t in (10, 15, 20, 25):
    d = res[f"stop{t}"] - res["bh"]
    print(t, d.mean(), d.median(), (res[f"stop{t}"] > res["bh"]).mean())
Full script with formatting and visualisation: trailing-stop-loss-cost-python.py
Output
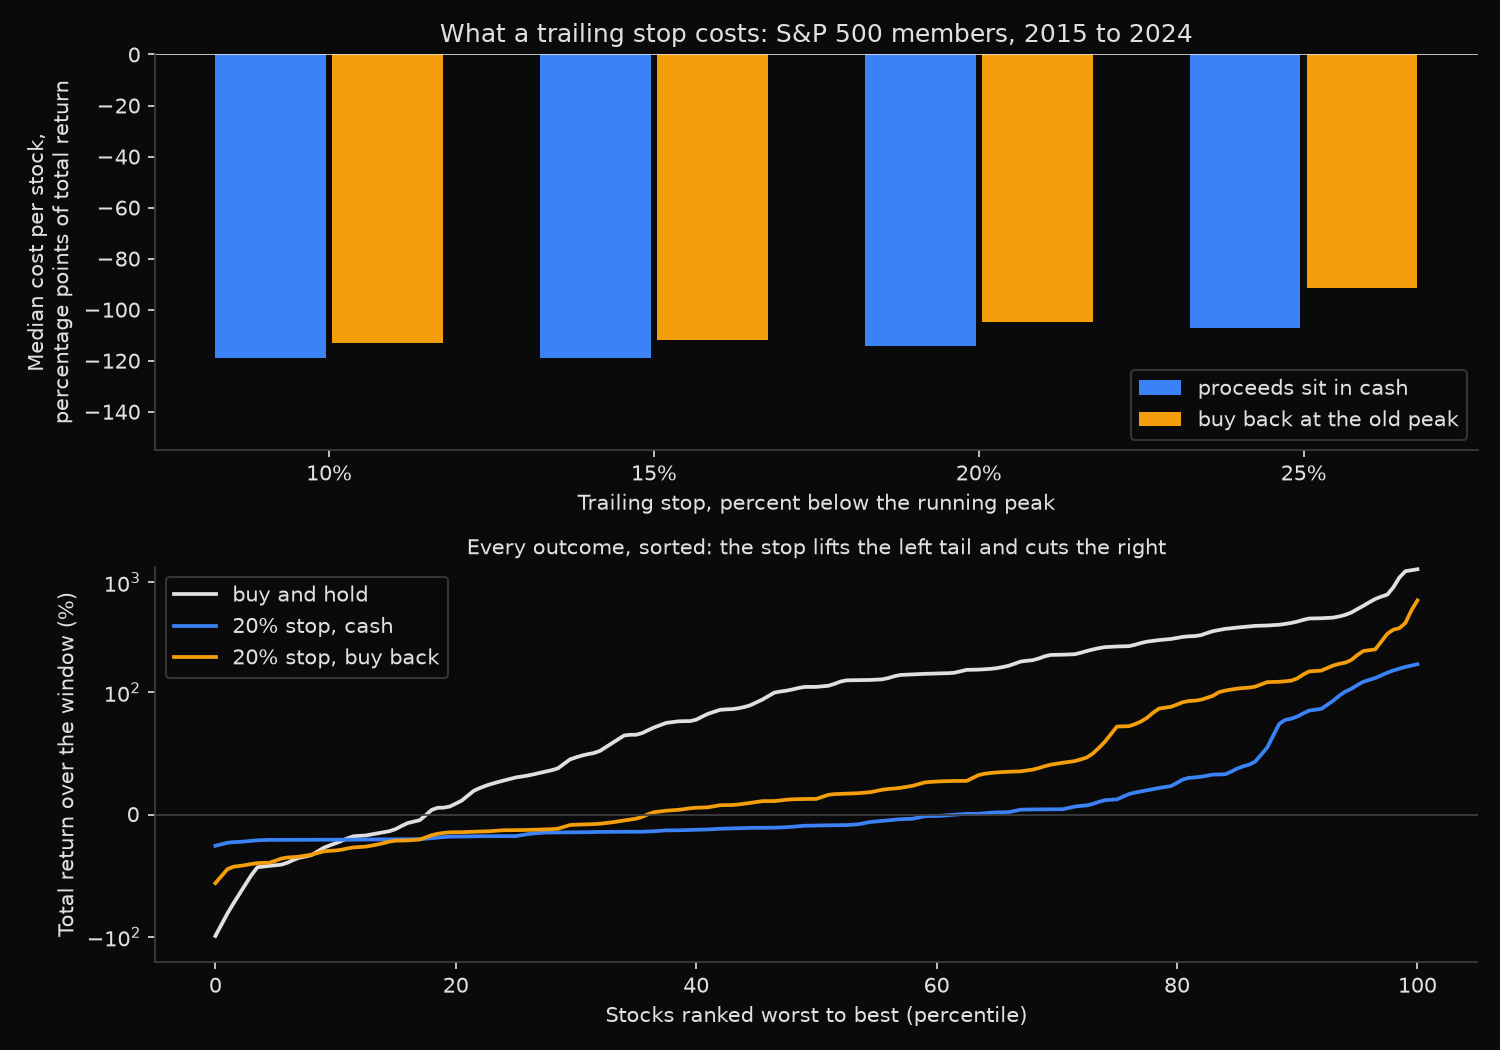
Trailing stops against buy and hold, point-in-time S&P 500 roster of 2015-01-02
Sample: 100 of the 500 members drawn with seed 20260902; 100 carry a daily series over the window (216,324 rows),
        2 set aside by the return screen and 9 by the 500-day minimum, leaving 89 names and 210,308 daily observations
        11 of them stop trading before the window ends and are measured to their last traded day; median history 10.0 years
Buy and hold: 5th pct -41.4%  median +112.1%  95th pct +570.7%  worst -99.2%  share below -50%: 3.4%

Rule A: sell at the stop, proceeds sit in cash earning nothing
stop   mean diff  median diff   stop beats   median CAGR   exits    5th pct     worst    share
 (%)       (pp)         (pp)         hold      diff (pp)   /name     return    return  <  -50%
  10     -182.6       -118.8        19.1%        -8.94    1.00     -11.4%     -19.2%     0.0%
  15     -179.9       -118.9        18.0%        -8.61    1.00     -16.2%     -19.2%     0.0%
  20     -171.8       -114.3        19.1%        -8.22    0.99     -20.6%     -25.5%     0.0%
  25     -152.5       -107.4        16.9%        -6.70    0.97     -26.0%     -33.0%     0.0%

Rule B: sell at the stop, buy back when the index regains the peak that triggered the exit
stop   mean diff  median diff   stop beats   median CAGR   round    5th pct     worst    share
 (%)       (pp)         (pp)         hold      diff (pp)   trips     return    return  <  -50%
  10     -159.6       -113.1        18.0%        -7.84    6.83     -35.5%     -51.9%     2.2%
  15     -152.2       -112.0        18.0%        -7.59    4.53     -37.2%     -49.5%     0.0%
  20     -136.5       -104.9        16.9%        -7.11    3.09     -37.7%     -56.0%     1.1%
  25     -122.7        -91.4        11.2%        -6.46    2.28     -43.5%     -49.9%     0.0%

How often the stop fires, and how far past the trigger the sale actually lands
  10% stop fires on 100.0% of names   median drawdown at the sale -10.95%   deepest single sale  -19.24%
  15% stop fires on 100.0% of names   median drawdown at the sale -15.66%   deepest single sale  -24.52%
  20% stop fires on  98.9% of names   median drawdown at the sale -20.92%   deepest single sale  -28.31%
  25% stop fires on  96.6% of names   median drawdown at the sale -25.84%   deepest single sale  -38.25%

Six worst buy-and-hold outcomes, total return %
     MNK  MALLINCKRODT PLC            5.8y   hold    -99.2   20% stop cash      7.8   20% stop buy back      7.8
      UA  UNDER ARMOUR INC           10.0y   hold    -78.4   20% stop cash     23.4   20% stop buy back     23.4
       M  Macy's, Inc.               10.0y   hold    -60.6   20% stop cash    -12.2   20% stop buy back    -12.2
     BEN  FRANKLIN RESOURCES INC     10.0y   hold    -43.1   20% stop cash    -20.3   20% stop buy back    -20.3
     HOG  HARLEY DAVIDSON INC        10.0y   hold    -41.8   20% stop cash    -25.5   20% stop buy back    -41.6
     SLB  SLB LIMITED/NV             10.0y   hold    -40.7   20% stop cash    -12.8   20% stop buy back    -12.8
Six best buy-and-hold outcomes, total return %
    AMZN  AMAZON COM INC             10.0y   hold   1313.8   20% stop cash     79.0   20% stop buy back    364.6
     LLY  LILLY ELI & CO             10.0y   hold   1253.6   20% stop cash      1.9   20% stop buy back    684.0
    ISRG  INTUITIVE SURGICAL INC     10.0y   hold    788.1   20% stop cash    154.6   20% stop buy back    178.8
     MSI  MOTOROLA SOLUTIONS INC     10.0y   hold    714.7   20% stop cash    136.0   20% stop buy back    391.6
     URI  UNITED RENTALS INC         10.0y   hold    606.8   20% stop cash    -20.5   20% stop buy back     57.9
     DHI  D R HORTON INC             10.0y   hold    516.5   20% stop cash      6.8   20% stop buy back     27.6
What this tells us
The insurance pays out, and it is expensive. Under Rule A the 20 percent stop cuts the median outcome by 114.3 percentage points of total return, or 8.22 points a year, and beats buy and hold on 19.1 percent of the 89 names. Widening the stop reduces the bill without reversing it, from 118.8 points at 10 percent to 107.4 at 25 percent.
The mean difference of 171.8 points is larger than the median because the biggest winners set it. Amazon returned 1,313.8 percent over the decade and the 20 percent stop sold it in the first year, finishing at 79.0 percent. That is what a stop does to the position that carries a portfolio. A drawdown-state analysis of the best days charts when the largest single-session gains arrive, read against how far a fund sits below its peak.
The left tail is genuinely truncated, which is the honest case for the rule. Buy and hold put 3 of the 89 names below a 50 percent loss; under Rule A none finishes below minus 50 percent at any threshold, the worst 20 percent stop outcome being minus 25.5 percent. Mallinckrodt lost 99.2 percent before it stopped trading, and the stop exited at plus 7.8 percent. Above roughly the tenth percentile of outcomes, though, the stopped distribution sits below buy and hold everywhere.
The protection is looser than the label. Because the trigger is checked at the close, the 20 percent stop sells at a median drawdown of 20.92 percent, and its deepest sale came at 28.31 percent. It also fires on nearly everything, selling every name at least once at the 10 and 15 percent thresholds.
Rule B changes the shape without changing the sign. Buying back at the old peak trims the median cost to 104.9 points at 20 percent while running 3.09 round trips per name, and gives back part of the protection: one name still finishes below minus 50 percent. A stock that falls in steps stops out, recovers, and stops out again.
So what?
Price the insurance before buying it. A 20 percent trailing stop cost 8.2 points of annual return here for a floor near minus 25 percent on one position, which is worth paying only where a 25 percent loss would force something worse, such as a margin call.
For a diversified book the protection is cheaper elsewhere. Position sizing caps the loss from any one name and costs nothing in forgone rebound, while the stop charged its premium on all 89 names to protect against the 3 that needed it.
Where a stop is required, set its width from a measurement on the universe and holding period in question rather than from a round number. The four thresholds landed within 12 points of median return of each other, and the widest truncated the tail as well as the tightest.
Built with xfinlink — free financial data API for Python.