
How Much of S&P 500 Cash Flow Is Stock Compensation? Cross-Sectional Analysis in Python
August 4, 2026
What’s the question?
Share-based compensation is an expense on the income statement and an add-back on the cash flow statement. The accounting is correct. No cash leaves the building when an employee receives restricted stock, so the charge is reversed out on the way from net income to operating cash flow. The consequence is that operating cash flow, and free cash flow beneath it, is measured before the cost of paying part of the workforce in equity.
That cost is still paid. It is paid by existing owners through dilution rather than by the company’s bank account, so an investor who ranks companies on free cash flow is ranking them on a figure that treats one form of compensation as free and every other form as an expense.
Three questions follow: how large is the add-back across the S&P 500, where does it concentrate, and has it grown over the past decade?
The approach
Share-based compensation and operating cash flow sit on the same statement for the same period, so the ratio between them is scale-free.
- Take the S&P 500 roster at three vintages: end of 2015, end of 2020, and current. Membership is point-in-time, so each cross-section holds the companies that were in the index on that date rather than the companies in it today.
- For every member, pull the most recent annual filing whose period ends inside an eighteen-month window opening on 1 January of the vintage year. Companies reporting positive operating cash flow and a positive share-based compensation line enter the sample.
- Divide share-based compensation by operating cash flow for each company, then report medians and upper percentiles. The distribution has a long right tail, so a mean would describe nobody.
- Repeat the comparison on the subset of companies that appear on both the 2015 roster and the current one. This separates a change in company behaviour from a change in index membership.
- Compare share-based compensation against share repurchases in the latest filings, to see how much of the buyback bill goes to offsetting the compensation charge.
Code
import pandas as pd
import xfinlink as xfl

xfl.set_api_key("YOUR_API_KEY")  # free at https://xfinlink.com/signup

FIELDS = ["operating_cash_flow", "stock_based_compensation_cf",
          "share_repurchases", "gics_sector"]

def cross_section(as_of, start, end):
    roster = xfl.index("sp500", as_of=as_of)
    ids = sorted({int(e) for e in roster["entity_id"].dropna()})
    frames = [xfl.fundamentals(entity_id=ids[i:i + 100], period_type="annual",
                               start=start, end=end, fields=FIELDS)
              for i in range(0, len(ids), 100)]
    df = pd.concat(frames, ignore_index=True)
    latest = df.sort_values(["entity_id", "period_end"]).groupby("entity_id").tail(1)
    latest = latest[(latest["operating_cash_flow"] > 0) &
                    (latest["stock_based_compensation_cf"] > 0)].copy()
    latest["sbc_share"] = (latest["stock_based_compensation_cf"] /
                           latest["operating_cash_flow"])
    return latest

panels = {
    "FY2015": cross_section("2015-12-31", "2015-01-01", "2016-06-30"),
    "FY2020": cross_section("2020-12-31", "2020-01-01", "2021-06-30"),
    "latest": cross_section(None, "2025-01-01", "2026-06-30"),
}

for name, p in panels.items():
    s = p["sbc_share"]
    print(name, len(p), f"{s.median():.1%}", f"{s.quantile(0.90):.1%}",
          f"{(s > 0.10).mean():.1%}")

cur, old = panels["latest"], panels["FY2015"]

# Same companies on both rosters: behaviour, stripped of membership change.
both = set(old["entity_id"]) & set(cur["entity_id"])
for label, p in [("FY2015", old), ("latest", cur)]:
    s = p[p["entity_id"].isin(both)]["sbc_share"]
    print(label, f"{s.median():.1%}", f"{s.quantile(0.90):.1%}", f"{(s > 0.10).mean():.1%}")

sec = (cur.groupby("gics_sector")["sbc_share"].agg(["size", "median"])
          .join(old.groupby("gics_sector")["sbc_share"].median().rename("median_2015"))
          .sort_values("median", ascending=False))
print(sec)

buy = cur[cur["share_repurchases"] > 0].copy()
buy["offset"] = buy["stock_based_compensation_cf"] / buy["share_repurchases"]
print(len(buy), f"{buy['offset'].median():.1%}", (buy["offset"] > 1.0).sum())
Full script with formatting and visualisation: stock-based-compensation-share-of-cash-flow-python.py
Output
==========================================================================
SHARE-BASED COMPENSATION AS A SHARE OF OPERATING CASH FLOW
S&P 500 members on the roster at each vintage
==========================================================================
vintage     firms    median   75th pct   90th pct   above 10%
FY2015        398     4.2%       7.6%      14.3%       15.6%
FY2020        428     4.3%       7.7%      16.3%       18.0%
latest        461     4.8%       8.9%      24.3%       22.3%

SAME COMPANIES ON BOTH ROSTERS (280 firms)
              median   90th pct   above 10%
FY2015         4.1%      13.1%       14.3%
latest         4.1%      15.5%       15.7%

BY SECTOR, LATEST ANNUAL FILINGS
sector                      firms    median    FY2015
Information Technology         70    18.1%     11.1%
Communication Services         17     8.6%      5.4%
Consumer Discretionary         51     5.7%      4.6%
Health Care                    56     5.6%      6.3%
Financials                     63     4.7%      4.2%
Consumer Staples               34     3.8%      3.2%
Industrials                    74     3.8%      3.8%
Materials                      24     3.5%      2.8%
Real Estate                    28     2.4%      2.9%
Energy                         18     1.9%      2.9%
Utilities                      25     1.4%      1.2%

BUYBACKS VERSUS SHARE-BASED COMPENSATION, LATEST FILINGS
repurchasers                            355
median SBC / buyback spend            15.8%
SBC above half of buyback spend          76
SBC above all buyback spend              39
What this tells us
The typical S&P 500 company adds back about one dollar in twenty: the median is 4.8% of operating cash flow. That number is modest and it is also misleading, because the distribution is heavily skewed. The 75th percentile sits at 8.9% and the 90th at 24.3%, meaning one company in ten reports cash generation that is roughly a quarter share-based compensation.
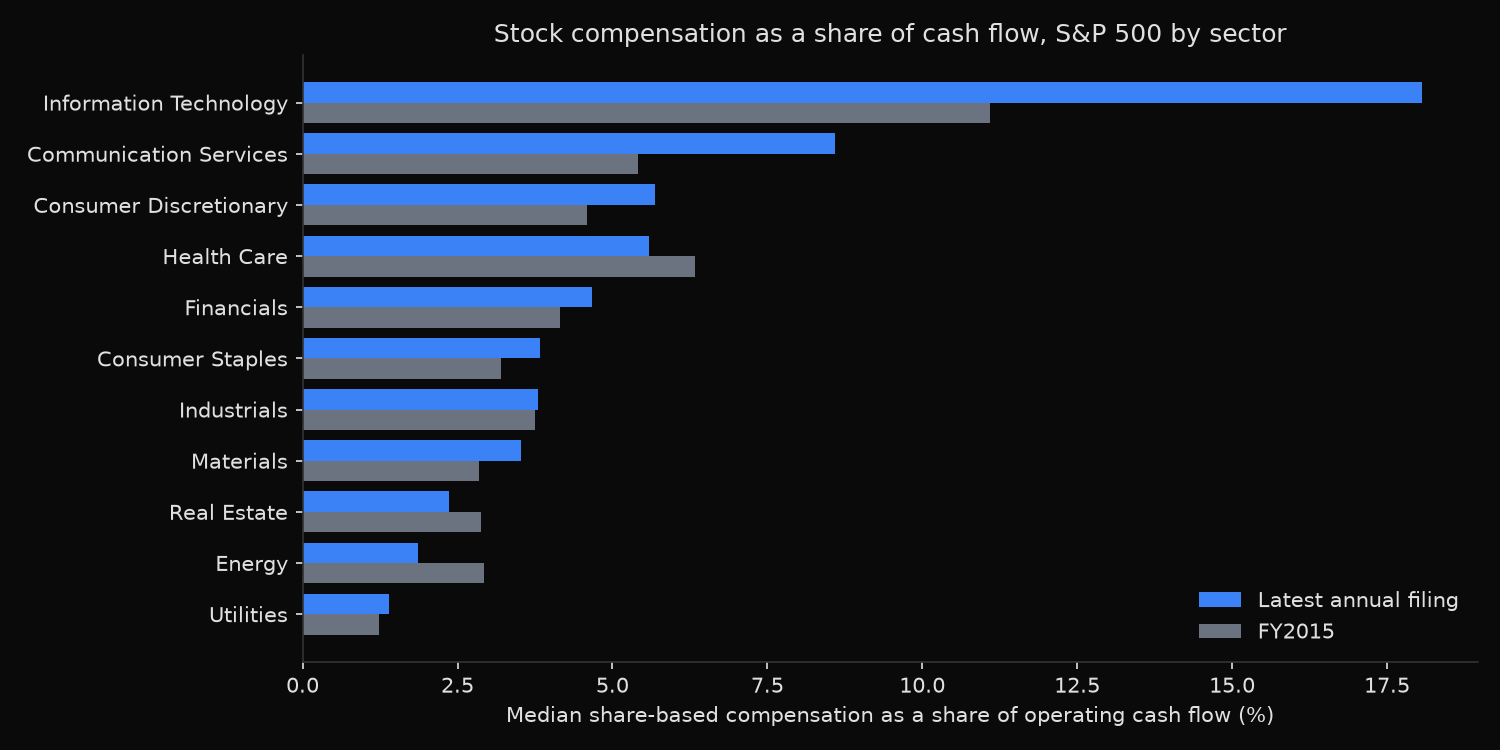
Sector spread is wide: Information Technology has a median of 18.1% against 1.4% for Utilities, a gap of thirteen times. Comparing a software company and a utility on free cash flow without an adjustment compares two quantities that mean different things.
The decade comparison contains the finding that matters. Across the full roster, the 90th percentile rose from 14.3% to 24.3% and the proportion above 10% rose from 15.6% to 22.3%, which reads as a market-wide escalation. It mostly is not one. Restricting the comparison to the 280 companies that sit on both the 2015 and the current roster, the median does not move at all, the 90th percentile rises only from 13.1% to 15.5%, and the proportion above 10% rises from 14.3% to 15.7%. Most of the apparent escalation is index composition: the S&P 500 has replaced members with companies that already paid heavily in stock when they joined. Health Care, Real Estate and Energy medians fell over the same period.
Buybacks absorb less of this than headline repurchase figures suggest. For the median repurchaser, an amount equal to 15.8% of the buyback bill matches the year’s compensation charge; 76 of 355 repurchasers spend more than half; and for 39 of them the compensation charge exceeds the entire repurchase programme.
So what?
Two adjustments follow directly. Subtract share-based compensation from free cash flow before any cross-sector screen or multiple, since the size of the correction runs from a median of 18% of operating cash flow in technology to 1% in utilities. Then treat buyback spending net of compensation rather than gross, because gross repurchase dollars overstate what returns to continuing owners.
The composition result carries a separate warning for anyone tracking index-level fundamentals through time. Aggregate S&P 500 statistics move when the index changes its members, not only when companies change behaviour. Any claim that corporate practice has shifted needs a same-company comparison before it can be believed, and the point-in-time roster makes that comparison a few lines of code.
Built with xfinlink — free financial data API for Python. pip install -U xfinlink
pip install -U xfinlink