
Does Gross Profitability Predict Stock Returns? Quintile Factor Test in Python
July 26, 2026
What's the question?
Gross profit is revenue minus the cost of producing what was sold. It sits at the top of the income statement, above research, advertising, depreciation and tax. Robert Novy-Marx argued in a 2013 paper that gross profit over total assets predicts returns about as well as book-to-market, and works because it is measured so early. Every line below it reflects a management choice, so a company spending heavily on research reports lower net income while building something valuable. Profitability measured further down the statement penalises the firms it ought to reward.
That argument was built on the broad US market, thousands of stocks including small and thinly traded ones. The S&P 500 is a different population, already screened for profits by the committee that picks it: net income from continuing operations must be positive in the most recent quarter and across the trailing four. If gross profitability captures a real mispricing it should still show up there. If it was a small-cap effect it should not.
The approach
The test sorts the index into quintiles by gross profitability every 30 June from 2015 to 2025 and measures the following twelve months.
- Take S&P 500 membership as it stood on each formation date through
as_of, so companies later acquired or removed stay in their cohorts. - Accept an annual report only if it was knowable that day: the fiscal year ended at least 180 days earlier and the filing was already submitted. Restated figures arrive in the following year’s report, which is why the median characteristic is 547 days old.
- Build gross profit twice, as revenue minus cost of revenue and from the reported gross profit line, then discard filings where the two disagree by more than 5% of revenue, since both line items turn up mis-tagged. That removed 303 of 3,828 name-years.
- Compound twelve monthly total returns forward, requiring all twelve and a price series that already exists at formation.
- Equal-weight the quintiles within each cohort and take the top fifth minus the bottom fifth. Eleven annual spreads give eleven independent observations for a one-sample t-test.
- Repeat the sort neutral to sector, on net income over assets, and with the filing-date rule off.
Financials and real estate are excluded, since gross profit means nothing for a bank or a landlord. Names without usable filings for the formation window, almost all acquired or delisted, drop from the sample, leaving 410 of 491 members in the earliest cohort. The output below is the run of 26 July 2026. Filings coverage for delisted names has been extended since that run: as of 31 July 2026 the same eleven point-in-time rosters return filings for 664 of their 699 symbols.
Code
import numpy as np
import pandas as pd
from scipy import stats
import xfinlink as xfl

xfl.set_api_key("YOUR_API_KEY")  # free at https://xfinlink.com/signup

FORMATIONS = [pd.Timestamp(f"{y}-06-30") for y in range(2015, 2026)]
FIELDS = ["period_end", "filing_date", "gics_sector", "revenue",
          "cost_of_revenue", "gross_profit", "total_assets", "net_income"]

universe = {f.year: xfl.index("sp500", as_of=f.strftime("%Y-%m-%d")) for f in FORMATIONS}
tickers = sorted({t for u in universe.values() for t in u["ticker"]})

px = xfl.prices(tickers, start="2015-06-01", end="2026-07-01", interval="1mo")
fun = xfl.fundamentals(tickers, period_type="annual", start="2011-01-01", fields=FIELDS)
fun = fun.dropna(subset=["period_end", "filing_date"])

rows = []
for formation in FORMATIONS:
    pool = fun[fun["ticker"].isin(set(universe[formation.year]["ticker"]))]

    # knowable at formation: reported 180+ days ago AND already filed
    known = pool[(pool["period_end"] <= formation - pd.Timedelta(days=180)) &
                 (pool["filing_date"] <= formation)]
    chars = known.sort_values("period_end").groupby("ticker").tail(1)

    window = px[(px["date"] > formation) &
                (px["date"] <= formation + pd.DateOffset(years=1))]
    grouped = window.groupby("ticker")["return_daily"]
    fwd = grouped.apply(lambda s: np.prod(1 + s.values) - 1)[grouped.size() == 12]

    rows.append(chars.assign(formation=formation, fwd_ret=chars["ticker"].map(fwd)))

panel = pd.concat(rows, ignore_index=True)
panel = panel[~panel["gics_sector"].isin({"Financials", "Real Estate"})]
panel = panel.dropna(subset=["revenue", "cost_of_revenue", "gross_profit",
                             "net_income", "total_assets", "fwd_ret"])

# two independent builds of gross profit; disagreement means a mis-tagged line
derived = panel["revenue"] - panel["cost_of_revenue"]
panel = panel[(derived - panel["gross_profit"]).abs() / panel["revenue"] <= 0.05]

panel["gpa"] = derived / panel["total_assets"]
panel["roa"] = panel["net_income"] / panel["total_assets"]
panel["quintile"] = panel.groupby("formation")["gpa"].transform(
    lambda s: pd.qcut(s.rank(method="first"), 5, labels=[1, 2, 3, 4, 5]).astype(int))

per = panel.groupby(["formation", "quintile"])["fwd_ret"].mean().unstack()
diff = per[5] - per[1]
t, p = stats.ttest_1samp(diff.values, 0)

print((per.mean() * 100).round(1).to_dict())
print(f"Q5-Q1 {diff.mean() * 100:.1f}pp  t={t:.2f}  p={p:.3f}")
Full script with formatting and visualisation: gross-profitability-forward-returns-python.py
Output
================================================================================
GROSS PROFITABILITY AND FORWARD RETURNS | S&P 500 point-in-time universe
================================================================================
Formations         : 11 annual, 30 June 2015 to 30 June 2025
Name-years         : 3,525   companies: 473
Characteristic lag : median 547 days from fiscal year end to formation
Dropped, the two gross profit builds disagree by >5% of revenue: 303 of 3828
Tickers returning no filings: 63 of 688 (delisted names)   no prices: 4

Universe coverage by cohort
 formation  in_index  with_filings  with_characteristic
      2015       491           441                  410
      2016       492           451                  429
      2017       496           464                  459
      2018       496           470                  466
      2019       498           476                  473
      2020       499           478                  477
      2021       499           482                  481
      2022       498           487                  486
      2023       496           492                  492
      2024       495           492                  492
      2025       495           492                  492

--------------------------------------------------------------------------------
AVERAGE forward 12-month total return by quintile (%)
--------------------------------------------------------------------------------
sort                             Q1     Q2     Q3     Q4     Q5    Q5-Q1      t      p
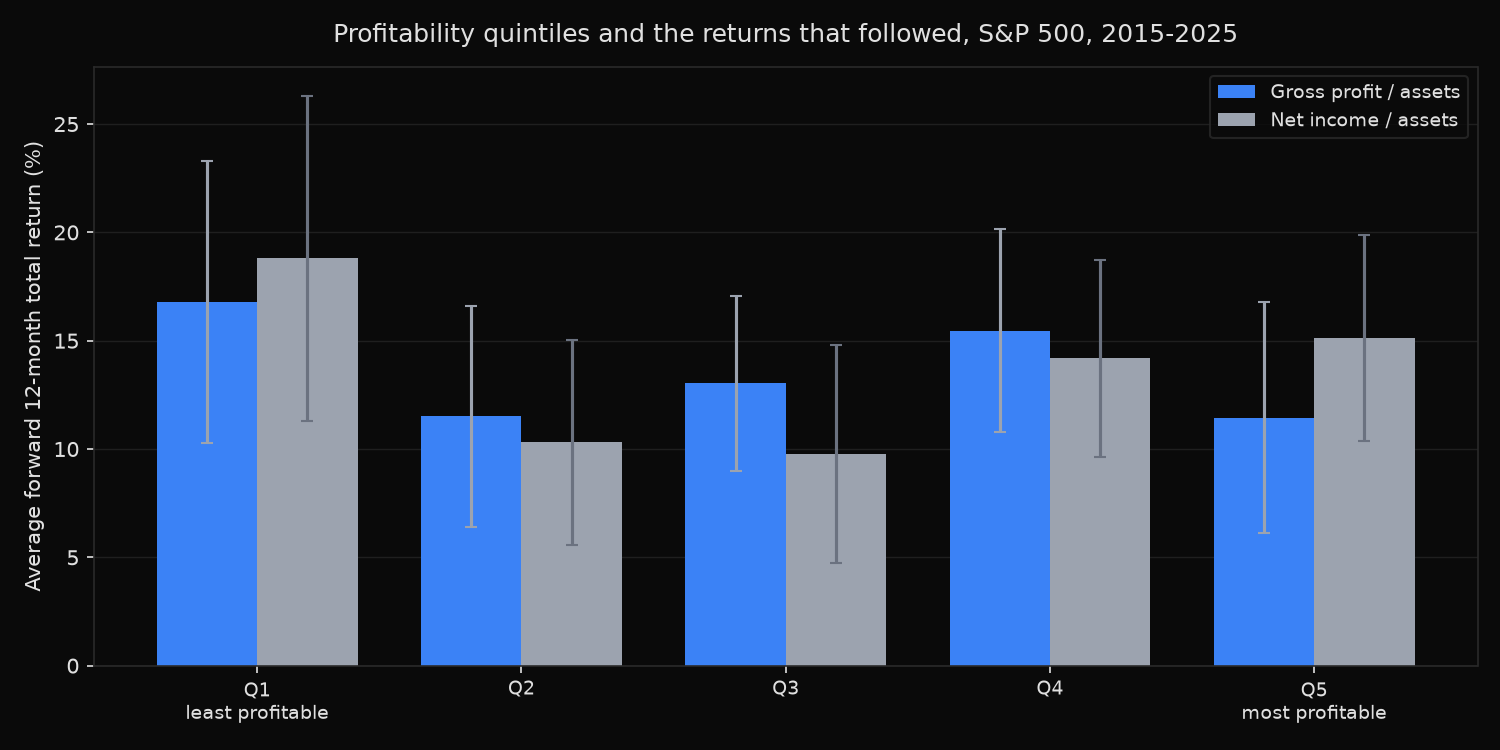
Gross profit / assets          16.8   11.5   13.0   15.5   11.5     -5.3  -1.09  0.301
  sector-neutral               17.2   11.6   12.1   14.1   13.2     -4.0  -0.86  0.410
Net income / assets            18.8   10.3    9.8   14.2   15.1     -3.7  -0.61  0.558
GP/A, no cross-validation      17.8   10.7   13.5   14.4   11.3     -6.5  -1.36  0.202
GP/A, look-ahead allowed       14.0   14.1   12.7   15.5   12.0     -2.0  -0.50  0.625

MEDIAN forward 12-month total return by quintile (%)
sort                             Q1     Q2     Q3     Q4     Q5    Q5-Q1      t      p
Gross profit / assets          10.5    9.3   11.0    9.8    9.9     -0.6  -0.22  0.829
  sector-neutral                9.7    9.6    9.9   10.7    9.5     -0.2  -0.12  0.907
Net income / assets            11.7    8.5    8.2   11.0   10.8     -0.8  -0.22  0.829

--------------------------------------------------------------------------------
Rank information coefficient (Spearman, characteristic vs forward return)
--------------------------------------------------------------------------------
Gross profit / assets        mean IC +0.002   t +0.07   p 0.946   positive in 7/11 cohorts
  sector-neutral             mean IC +0.009   t +0.30   p 0.768   positive in 6/11 cohorts
Net income / assets          mean IC +0.032   t +0.75   p 0.473   positive in 7/11 cohorts

--------------------------------------------------------------------------------
Gross profitability Q5-Q1 spread by cohort (%)
--------------------------------------------------------------------------------
             n  universe_mean    Q1    Q5  Q5-Q1
formation
2015       302            4.2   9.6   1.8   -7.8
2016       309           15.7   8.9   5.3   -3.6
2017       285           15.3  11.6  21.4    9.8
2018       296            9.8   4.1  13.2    9.1
2019       305           -2.8 -14.6  -1.5   13.0
2020       321           49.9  54.5  55.2    0.7
2021       325           -8.7   1.4 -14.7  -16.2
2022       335           17.6  23.9  19.1   -4.8
2023       360           11.7  13.5  10.0   -3.5
2024       350            8.5  14.5   5.3   -9.2
2025       337           29.0  57.4  11.1  -46.3

Widest negative cohort 2025: Q1 mean 57.4% vs median 13.7% across 68 names
ticker            gics_sector  fiscal_year    gpa  fwd_ret
   WDC Information Technology         2023  0.077    898.0
    MU Information Technology         2023 -0.022    837.0
  INTC Information Technology         2023  0.113    523.0
   GLW Information Technology         2023  0.138    386.0
  MRNA            Health Care         2023  0.117    154.0

Spearman correlation between the two characteristics: 0.599
What this tells us
Nothing survives. The most profitable fifth returned 11.5% a year on average and the least profitable fifth returned 16.8%, a spread of −5.3 points, t of −1.09, p of 0.301. The sign runs backwards and the size is indistinguishable from zero. Quintiles two through four land at 11.5%, 13.0% and 15.5%, which is not an ordering.
The rank information coefficient agrees: at plus 0.002 with a p-value of 0.946, the correlation between a company’s profitability rank and its rank on the next year’s return is noise.
Medians settle what those outliers did: the same sort gives a spread of −0.6 points, and almost the entire negative average traces to one cohort. The June 2025 sort put memory and semiconductor names in the bottom quintile after the downturn crushed their fiscal 2023 gross margins, and those names then returned 898% (WDC), 837% (MU) and 523% (INTC). Bottom-quintile names averaged 57.4% that year against a median of 13.7%. An annual accounting characteristic cannot tell a broken business from a cyclical one at the bottom of its cycle.
Sector neutrality does not rescue the result, at −4.0 points and p of 0.410, and net income over assets fails on the same terms. Relaxing the filing-date rule, the look-ahead most published backtests carry silently, moves the spread to −2.0: a different number, the same answer.
The explanation is the population, not the characteristic. The committee requires positive earnings before admission, so the S&P 500 is itself a profitability screen, and sorting on profitability inside it ranks firms that already cleared the same bar.
So what?
Do not expect a quality screen inside a large-cap index to pay a return premium. Over eleven years it paid nothing measurable either way. A backtest claiming otherwise on this universe deserves a check for the three defects that produced spurious numbers here: a mean dragged by a handful of names, accounting inputs that disagree with themselves, and characteristics that were not public at formation.
Gross profitability still earns a place in a research stack, just not as a return signal by itself. Paired with a valuation screen it separates a cheap business from a broken one.
Four habits generalise. Report medians beside means, because five semiconductor names moved a headline spread by tens of points. Build accounting inputs twice from independent line items and discard disagreements, since 8% of filings failed that check. Enforce the filing date, not the period end. And publish the cohort table: eleven annual observations is thin, and a reader who sees 2025 at −46.3 points knows what the headline is worth.
Built with xfinlink — free financial data API for Python. pip install -U xfinlink
pip install -U xfinlink