
BLOG

Behind the numbers.

Code examples, market analysis, and data quality deep-dives.

Does Revenue Growth Explain Profit Growth? Cross-Sectional Decomposition in Python
How Much of the Nasdaq 100 Is Already in the S&P 500? Index Overlap Analysis in Python
How Often Does a 99% Value-at-Risk Limit Actually Break? VaR Backtesting in Python
Real-Time vs End-of-Day Market Data: Which Do You Need?
How Concentrated Are S&P 500 Earnings? Point-in-Time Index Analysis in Python
Does Volatility Scale With the Square Root of Time? Variance Ratio Test in Python
Does Goodwill Distort the Price-to-Book Screen? Goodwill-Adjusted Valuation in Python
How Are Shares Outstanding Reported (and Why They Disagree)
Do Low-Volatility Stocks Deliver Better Risk-Adjusted Returns? S&P 500 Quintile Sorts in Python
Does Trend Following Beat Buy and Hold? Time-Series Momentum in Python
Has the Stock-Bond Correlation Flipped? 60/40 Portfolio Risk in Python
What API to Use for a Stock Screener
Which Assets Hedge Inflation Shocks? Macro Factor Betas in Python
Does Covariance Shrinkage Beat the Sample Covariance? Minimum-Variance Portfolios in Python
Do Faster Inventory Turns Mean Thinner Margins? Gross Margin Return on Inventory in Python
SEC EDGAR API vs Fundamentals API: Which to Use
Does Fast Earnings Growth Persist? Rank Correlation Analysis in Python
Split Adjustment Explained: Adjusted Close vs Close
Which Trading Day of the Month Pays Best? Turn-of-the-Month Analysis in Python
Can You Use Yahoo Finance Data Commercially?
How Many Independent Bets Does a Nine-Sector Portfolio Give You? Eigenvalue Analysis in Python
Which Volatility Forecast Wins One Month Ahead? HAR vs EWMA in Python
How Concentrated Are Institutional Equity Portfolios? Form 13F Concentration Analysis in Python
Do Stocks Earn Their Returns Overnight or Intraday? Return Decomposition in Python
When Do Corporate Insiders Actually Trade? Form 4 Timing Analysis in Python
Data Requirements for Backtesting a Trading Strategy
What Is Survivorship Bias in Backtesting?
Do High Dividend Yields Come From Bigger Payouts or Falling Prices? Yield Decomposition in Python
Do Stocks Fall Harder Than They Rise? Downside Beta vs Upside Beta in Python
Does Volatility Targeting Improve Sharpe Ratios? Seven-Asset Backtest in Python
Free Stock Market Data APIs: What You Actually Get
How to Give an LLM Financial Data With an MCP Server
Does Post-Earnings Announcement Drift Survive Real Filing Dates? PEAD Event Study in Python
Do Insider Buying Clusters Predict Returns? Signal Testing in Python
Does the S&P 500 Index Effect Still Exist? Event Study in Python
Are Companies Leaving the S&P 500 Faster Than They Used To? Index Survival Analysis in Python
Does Gross Profitability Predict Stock Returns? Quintile Factor Test in Python
What Growth Rate Is the Market Pricing In? Reverse DCF in Python
Does a Strong Balance Sheet Cushion Drawdowns? Leverage and Downside Risk in Python
Does Ticker Recycling Corrupt a Mean-Reversion Backtest? Entity-Resolved Z-Scores in Python
How Much of a Growth Screen's Backtested Edge Is Survivorship Bias? Point-in-Time Index Testing in Python
Why Do Leveraged ETFs Decay? Measuring Volatility Drag in Python
Are Consumer Staples Margins Shrinking Under Inflation? Gross Margin Trend Analysis in Python
Do Weak Jobs Reports Predict Market Drawdowns? NFP Surprise Event Study in Python
Is the Rotation From Tech to Industrials Backed by Earnings? Relative EPS Growth Analysis in Python
Is the Semiconductor Rally Broadening Beyond NVIDIA? Return Dispersion Analysis in Python
Which Stocks Benefit Most When Oil Prices Fall? Oil Beta Screening in Python
Do Bond Returns Predict Stock Returns? Granger Causality Test in Python
Which Stocks Actually Drive Portfolio Returns? Shapley Value Attribution in Python
Does "Sell in May" Still Work? Calendar Anomaly Backtest in Python
How to Build Complete Price History Through Ticker Changes? Entity Resolution in Python
Are KO and PEP Cointegrated? Pairs Trading Signal Construction in Python
Which Commodities Have the Strongest Momentum? Rotation Backtest in Python
Which Commodity ETFs Have the Worst Tail Risk? Expected Shortfall in Python
Are Gold Miners Leveraged Gold Bets? Rolling Beta Analysis in Python
Does the Base-Metals-to-Gold Ratio Lead Cyclical Stocks? Signal Test in Python
Can Risk Parity Tame Commodity Volatility? Portfolio Optimization in Python
Are Power Stocks Becoming an AI Infrastructure Trade? Momentum Screening in Python
Which AI Chip Stocks Have Margin Momentum? Profitability Trend Analysis in Python
Which AI Stocks Are Cheapest Relative to Growth? Growth-Adjusted Valuation in Python
Does AI Stock Leadership Persist? Momentum Backtest in Python
Which AI Stocks Have the Cleanest Balance Sheets? Net Cash Screening in Python
Can Risk Parity Reduce Mega-Cap Drawdowns? Portfolio Optimization in Python
Which Growth Stocks Are Self-Funding? Cash-Flow Quality Screening in Python
Which Sectors Struggle When the Dollar Rallies? Sector Rotation Analysis in Python
Do Cheap Stocks Hold Up When Bonds Sell Off? Valuation Rotation in Python
Does the Nasdaq 100 Have Better Growth Quality Than the Dow? Index Constituent Analysis in Python
Do Healthcare Cash-Flow Margins Predict Returns? Signal Evaluation in Python
Which Dividend Stocks Survive a Cash-Flow Stress Test? Dividend Screening in Python
Does Heavy Insider Selling Predict Weak Returns? Insider Flow Test in Python
Can Quality Screens Reduce Small-Cap Balance-Sheet Risk? Russell 2000 Test in Python
Which Retailers Have Positive Operating Leverage? Margin Screening in Python
Is MSTR a Leveraged Bitcoin Proxy? Rolling Beta Analysis in Python
Is Micron's Memory Cycle Recovering? Inventory and Margin Forecasting in Python
Which Sectors Work When Bonds Rally? Rate-Sensitive Rotation in Python
Do One-Month Price Extremes Reverse? Signal Evaluation in Python
Do Low-Volatility S&P 500 Stocks Reduce Drawdowns? Factor Test in Python
Is AI Capex Paying Back Fast Enough? Revenue Hurdle Forecasting in Python
Could Shorter AI Asset Lives Hit Earnings? Depreciation Stress Test in Python
How Much AI Capex Risk Can a Portfolio Remove? Constrained Optimization in Python
Is the AI Capex Trade Crowded? Rolling Volatility and Sector Rotation in Python
Did the AI Boom Come From Existing S&P 500 Members? Point-in-Time Momentum Test in Python
Is AI Revenue Circular? Customer-Vendor Capex Loop Analysis in Python
Is the AI Trade Connected to Private Credit? Rolling Correlation Network in Python
Is Apollo More Balance-Sheet Sensitive Than Peers? Leverage Screen in Python
Are AI Earnings Supported by Cash Flow? Accrual and Capex Screen in Python
Can Defensive Stocks Hedge AI Drawdowns? Basket Regime Test in Python
How Fast Does the Market Price In Fed Decisions? FOMC Event Study in Python
How Much Are Options Sellers Overpaid? The Variance Risk Premium in Python
Which Companies Have the Worst Earnings Quality? Sloan Accrual Screen with Geographic Revenue Data in Python
Does the Oil-to-Gold Ratio Signal Recessions? XLE/GLD Backtest in Python
Is AI Spending Crowding Out Free Cash Flow? Capex Sustainability Across the Mag 7 in Python
Does a Long Energy / Short Bonds Portfolio Capture Inflation Surprises? Factor Construction in Python
Can a Hidden Markov Model Detect Oil Market Regimes? HMM Analysis in Python
Do Grain Prices Predict Food Inflation? Granger Causality Test in Python
Does the Corporate Credit Spread Predict Stock Market Crashes? BAA-AAA Spread Analysis in Python
Do Oil Stocks Hedge Inflation? Rolling Beta Analysis in Python
Which Stocks Are Most Rate-Sensitive? Equity Duration via Bond Beta in Python
Which Companies Have the Highest Accrual Ratios? Earnings Quality Screening in Python
Is Alpha Persistent or Decaying? Rolling Sharpe Ratio Analysis in Python
Are Markets Trending or Mean-Reverting? Hurst Exponent Analysis in Python
Is Consumer Discretionary vs Staples a Leading Indicator? XLY/XLP Ratio Analysis in Python
Does Heavy Capex Predict Future Stock Returns? Capital Expenditure Analysis in Python
How to Estimate Cost of Equity Using CAPM in Python
Is Volatility Predictable? Testing for Volatility Clustering in Python
Which Industrials Are Overleveraged? Net Debt to EBITDA Screening in Python
GM Before and After Bankruptcy: Why Entity Resolution Matters for Financial Data
What Is Adjusted Beta? Merrill Lynch Beta Shrinkage in Python
How Good Is a Stock Pick? Information Ratio and Tracking Error in Python
Do Stock Returns Follow a Normal Distribution? Testing for Fat Tails in Python
Which Large Caps Have the Highest Free Cash Flow Yield? FCF Screening in Python
Which Sectors Won Over 5 Years? Sector Rotation Analysis in Python
How to Forecast Stock Volatility with GARCH Models in Python
Are Stock Prices Mean-Reverting? Augmented Dickey-Fuller Test in Python
How to Calculate CAPM Alpha and Beta with Regression in Python
How to Compare Sector Sharpe Ratios and Sortino Ratios in Python
DELL: Why Stitching Historical Price Data Together Is Wrong
How to Analyze Drawdown and Recovery for Bank Stocks in Python
How to Screen SaaS Stocks by Revenue Growth and Cash Flow in Python
How to Screen REITs by Dividend Yield and Valuation in Python
How Correlated Are the Magnificent 7? Intra-Group Correlation in Python
AAPL vs XOM: Do Individual Stocks Have Seasonal Patterns?
How to Rank Large-Cap Stocks by Momentum in Python
How to Build a Multi-Endpoint Financial Dashboard in Python
How to Compare Volatility Across Energy Stocks in Python
How to Screen Healthcare Stocks by Valuation in Python
How to Build a Sector Correlation Matrix for Portfolio Diversification in Python
How to Find Oversold and Overbought Stocks Using Z-Scores in Python
How to Measure Earnings Quality: Cash Flow vs Net Income in Python
How to Build a Multi-Factor Stock Screen in Python (Value + Momentum + Quality)
How to Build a Simple DCF Model for Any Stock in Python
How to Screen Tech Stocks by Revenue Growth in Python
How to Screen Stocks by Balance Sheet Health in Python
Is "Sell in May" Real? SPY Monthly Seasonality Over 10 Years
How to Compare Sector Performance YTD Using Python
How to Screen Dividend Stocks by Yield and Quality in Python
How to Calculate Max Drawdown and Recovery Time for Any Stock in Python
How to Compare Profitability Across Mega-Cap Tech Stocks in Python
Why Ticker Symbols Are Unreliable: The Recycling Problem Every Quant Should Know
How to Calculate and Compare Stock Volatility in Python
How to Screen Blue-Chip Stocks by P/E Ratio in Python
How to Track Companies Through Ticker Changes, Bankruptcies, and Renames in Python
S&P 500 Turnover: How Much the Index Has Changed Since 2010
How to Calculate Stock Beta and Correlation in Python
← All articles

Does Revenue Growth Explain Profit Growth? Cross-Sectional Decomposition in Python

What’s the question?

Most earnings forecasts start with revenue. An analyst builds a sales line, applies a margin, and reads off profit. The margin is usually carried forward from recent history, because it is the number hardest to defend and easiest to leave alone.

That workflow contains a testable claim: revenue growth is what separates one company’s profit record from another’s, and margin is a second-order adjustment. The claim can be checked directly, because the relationship is an identity rather than a model. Profit equals revenue multiplied by net margin, which is net income divided by revenue. Take logarithms and profit growth splits into two additive pieces: growth in revenue, and change in margin. Nothing is estimated and no residual is left over.

Which piece carries the spread across companies? Two firms measured five years apart can report profit growth 60 percentage points apart. That gap traces either to their sales, or to everything between the top line and the bottom line: pricing, input costs, interest, tax.

The approach

  1. Take the S&P 500 roster as it stood on 31 December 2019, keyed to entity identifiers rather than tickers. Today’s list is a list of survivors, and a ticker is only a lease; either would tilt the answer before the arithmetic starts.
  2. Hold out banks, property trusts and regulated utilities. Revenue means something different for a lender, and a utility earns a return set in a rate case rather than in a market.
  3. Pull annual revenue and net income for fiscal 2017 through fiscal 2024, where fiscal year Y covers period ends from June of Y to May of Y+1. That places a January year end in the year it describes.
  4. Compare three-year totals rather than single years: fiscal 2017-2019 against fiscal 2022-2024, since one year of impairments can set a base that a growth rate then amplifies. Companies without all six fiscal years, or without positive totals in both windows, leave the sample.
  5. Split each company’s profit growth into its two terms, then decompose the variance of profit growth across companies into the variance of each term plus twice their covariance.

Code

import numpy as np
import pandas as pd
import xfinlink as xfl
from scipy import stats

xfl.set_api_key("YOUR_API_KEY")  # free at https://xfinlink.com/signup

BASE, RECENT = [2017, 2018, 2019], [2022, 2023, 2024]
HELD_OUT = {"Financials", "Real Estate", "Utilities"}

members = xfl.index("sp500", as_of="2019-12-31").dropna(subset=["entity_id"])
ids = sorted(set(members["entity_id"].astype(int)))

frames = [xfl.fundamentals(entity_id=ids[i:i + 100], period_type="annual",
                           start="2017-06-01", end="2025-05-31",
                           fields=["revenue", "net_income"], max_rows=100000)
          for i in range(0, len(ids), 100)]
f = pd.concat([x for x in frames if len(x)], ignore_index=True)
d = pd.to_datetime(f["period_end"])
f["fy"] = np.where(d.dt.month < 6, d.dt.year - 1, d.dt.year)
f = f[~f["gics_sector"].isin(HELD_OUT)].dropna(subset=["revenue", "net_income"])
f = f.sort_values("period_end").groupby(["entity_id", "fy"], as_index=False).tail(1)

rows = []
for eid, g in f.groupby("entity_id"):
    g = g.set_index("fy")
    if not all(y in g.index for y in BASE + RECENT):
        continue
    a, b = g.loc[BASE], g.loc[RECENT]
    r1, r2 = a["revenue"].sum(), b["revenue"].sum()
    p1, p2 = a["net_income"].sum(), b["net_income"].sum()
    if min(r1, r2, p1, p2) <= 0:
        continue
    rows.append({"g_rev": np.log(r2 / r1),
                 "g_mar": np.log((p2 / r2) / (p1 / r1)),
                 "g_prof": np.log(p2 / p1)})
w = pd.DataFrame(rows)

var_p = w["g_prof"].var()
cov2 = 2 * w[["g_rev", "g_mar"]].cov().iloc[0, 1]
print("revenue %.1f%%  margin %.1f%%  covariance %.1f%%"
      % (100 * w["g_rev"].var() / var_p, 100 * w["g_mar"].var() / var_p, 100 * cov2 / var_p))
print("R-squared on revenue growth alone: %.3f"
      % stats.linregress(w["g_rev"], w["g_prof"]).rvalue ** 2)

Full script with formatting and visualisation: revenue-growth-vs-margin-profit-decomposition-python.py

Output
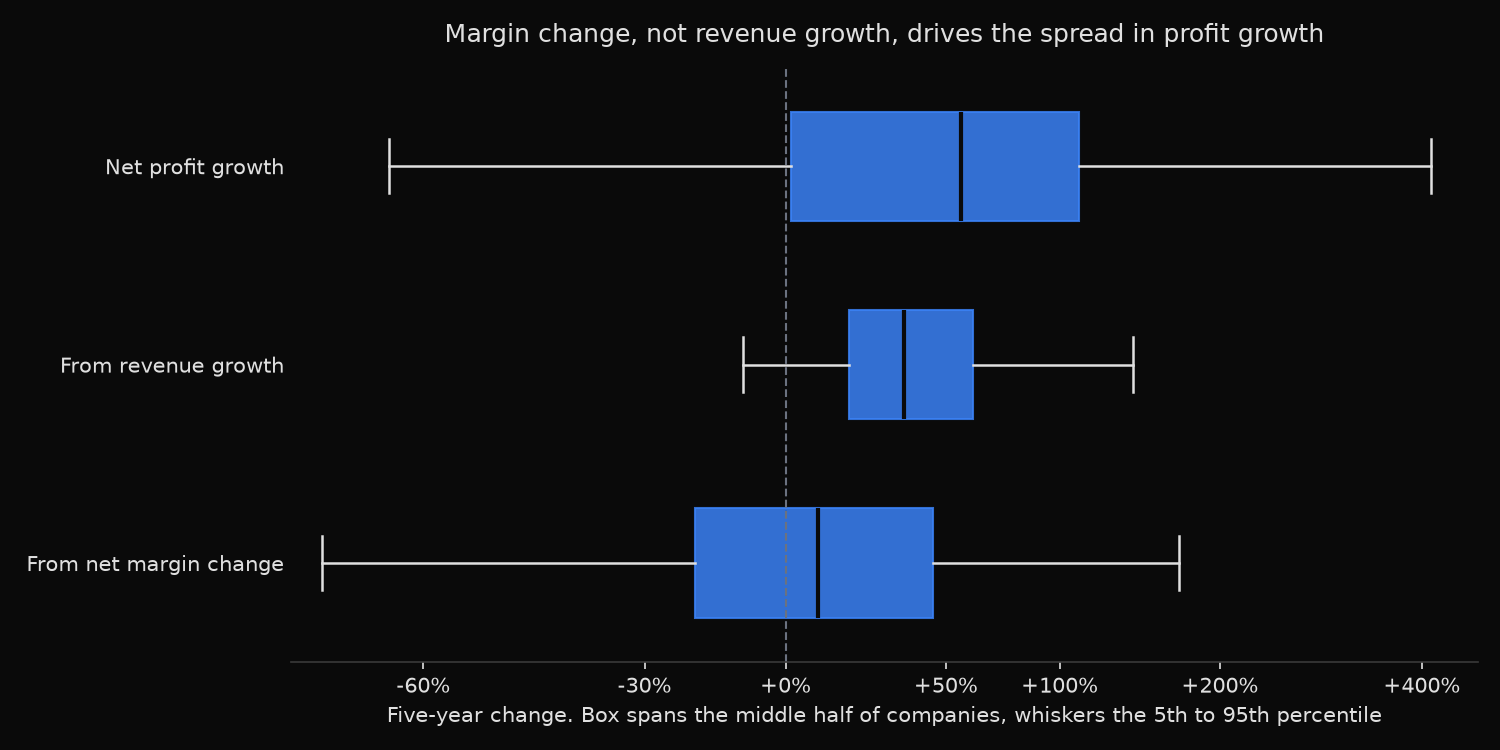
Box plot comparing the spread of five-year net profit growth, the revenue term and the net margin term across 296 S&P 500 companies
Five-year profit growth decomposition, S&P 500 members outside
banks, property trusts and regulated utilities
Roster point-in-time at 2019-12-31; fiscal 2017-2019 totals against
fiscal 2022-2024 totals
500 on the roster, 361 after the sector hold-out, 296 in the sample

Median five-year change (each line a separate median, so the two
terms need not multiply out to the profit figure)
  net profit                      +55.9%
  revenue term                    +35.0%
  net margin term                  +8.6%
  median net margin        10.4% ->  11.4%

Share of the cross-sectional variance in profit growth
  revenue growth                   14.4%
  net margin change                79.7%
  covariance of the two             5.9%
  margin share, 1st/99th trim      71.2%  (n = 290)
  R-squared, profit growth on revenue growth   0.210
  revenue up and profit down       18.2% of companies
  revenue down and profit up        4.1% of companies

By revenue-growth quartile      n   revenue    margin    profit   profit fell
  Q1 slowest       74     +3.2%     -3.0%     +3.0%         49%
  Q2               74    +26.0%     -4.4%    +20.7%         30%
  Q3               74    +43.5%    +12.8%    +63.3%         15%
  Q4 fastest       74    +87.2%    +17.7%   +117.6%          5%

By sector                       n   revenue    margin    profit   net margin
  Energy                     18    +63.9%    +64.8%   +169.7%    7.6% -> 12.0%
  Information Technology     47    +39.5%    +15.1%    +73.2%   14.3% -> 17.9%
  Health Care                49    +47.5%     -9.3%    +56.4%   13.2% -> 12.5%
  Materials                  24    +31.3%     +7.6%    +48.6%   10.1% -> 10.5%
  Industrials                66    +33.3%     +8.0%    +47.6%   10.0% -> 11.5%
  Consumer Discretionary     45    +31.2%    +13.5%    +44.0%    7.9% ->  9.3%
  Consumer Staples           32    +26.0%     -7.8%    +12.8%   11.0% ->  9.3%
  Communication Services     15    +36.2%    -11.4%    +11.6%   13.0% ->  9.4%

What this tells us

For the typical company, revenue did most of the work. Median profit growth was 55.9%, with the revenue term supplying 35.0% and the margin term 8.6%. Net margin at the median company widened from 10.4% to 11.4% across five years containing a pandemic and an inflation shock.

The spread tells a different story. Variance in profit growth across the 296 companies splits into 14.4% from revenue growth, 79.7% from margin change, and 5.9% from the covariance between them. A regression of profit growth on revenue growth alone returns an R-squared of 0.210, and that figure is generous, because it credits revenue with the shared covariance too. Four fifths of the difference between one company’s five-year profit record and another’s sits in what happened to margin.

Some of that is definitional, since the margin term equals profit growth minus revenue growth and collects whatever revenue does not explain. The substance is how tightly revenue growth clusters. The middle half of the sample grew revenue between 17.5% and 60.7%; the same middle half grew profit between 1.3% and 110.0%, a band two and a half times wider. Large American companies differ far less in how fast they sell than in what they keep.

The quartile table shows how loose the company-level link is. Among the 74 slowest revenue growers, 36 ended the period with lower profit; among the 74 fastest, 4 did. Across the sample, 18.2% grew revenue and earned less at the end of it.

Sector medians locate the moves: energy gained 64.8% of margin off a depressed base, health care gave back 9.3%, consumer staples 7.8%. Trimming the extreme 1% at each end of profit growth leaves the margin share at 71.2%, so a few violent recoveries are not carrying the result.

So what?

A revenue forecast settles a minority of the earnings question. Effort spent refining a sales projection past its second decimal place buys less accuracy than an hour on the margin path: pricing power against input costs, mix shift, the interest bill on refinanced debt, the tax rate, and how much of reported profit is one-off.

Two habits follow. When screening, rank candidates on margin trajectory rather than sales trajectory; sales growth in a large-cap universe is compressed into a narrow band, and ranking on a narrow band mostly ranks noise. When building a model, treat a flat-margin assumption as an assumption about four fifths of the answer and write it down as such.

Built with xfinlink — free financial data API for Python. pip install -U xfinlink

Built with xfinlink — free financial data API for Python. pip install -U xfinlink
← All articles