
What's the question?
Low-volatility investing is based on a simple claim: stocks with lower realized volatility should produce smoother portfolio outcomes. The claim is not that low-volatility stocks always outperform. The claim is that they can reduce drawdowns and improve risk control.
That distinction matters. In a strong risk-on market, high-volatility stocks may produce higher returns. A low-volatility factor can still be useful if it limits downside when conditions deteriorate. The practical question is whether low-volatility S&P 500 members reduced drawdowns over the last year, using the index membership that existed at the start of the test.
Using point-in-time membership matters because it avoids looking only at today's surviving index members.
The approach
The universe starts with S&P 500 constituents as of June 5, 2025. The script then intersects that index membership with a liquid common-stock candidate set and requires current price coverage. Built from SEC EDGAR public filings and market data, the analysis uses daily split-adjusted prices through June 4, 2026.
- Pull S&P 500 membership with
as_of="2025-06-05" - Pull daily prices for the liquid member subset
- Calculate realized annualized volatility for each stock
- Build the 10 lowest-volatility and 10 highest-volatility baskets
- Compare average total return and max drawdown
The result is a factor diagnostic, not a complete portfolio backtest. A decade-long quintile backtest of the same factor supplies the portfolio version.
Code
import xfinlink as xfl
import pandas as pd

xfl.set_api_key("YOUR_API_KEY")  # free at https://xfinlink.com/signup

members = xfl.index("sp500", as_of="2025-06-05", limit=500)
tickers = sorted(set(members["ticker"]))[:100]

df = xfl.prices(tickers, start="2025-06-05", fields=["adj_close"])
prices = df.pivot_table(index="date", columns="ticker", values="adj_close").dropna(axis=1, thresh=200)
returns = prices.pct_change(fill_method=None).dropna()

vol = returns.std() * (252 ** 0.5)
low_vol = vol.nsmallest(10).index
high_vol = vol.nlargest(10).index

print("Low-vol basket return", (prices[low_vol].iloc[-1] / prices[low_vol].iloc[0] - 1).mean())
print("High-vol basket return", (prices[high_vol].iloc[-1] / prices[high_vol].iloc[0] - 1).mean())
Full script with formatting and visualisation: sp500-low-volatility-drawdown-python.py
Output
=== Point-in-Time S&P 500 Low-Volatility Drawdown Test ===
Constituent date: 2025-06-05
Price sample: 2025-06-06 to 2026-06-04 (249 trading days)
Tested liquid member subset: 53 stocks

Basket comparison:
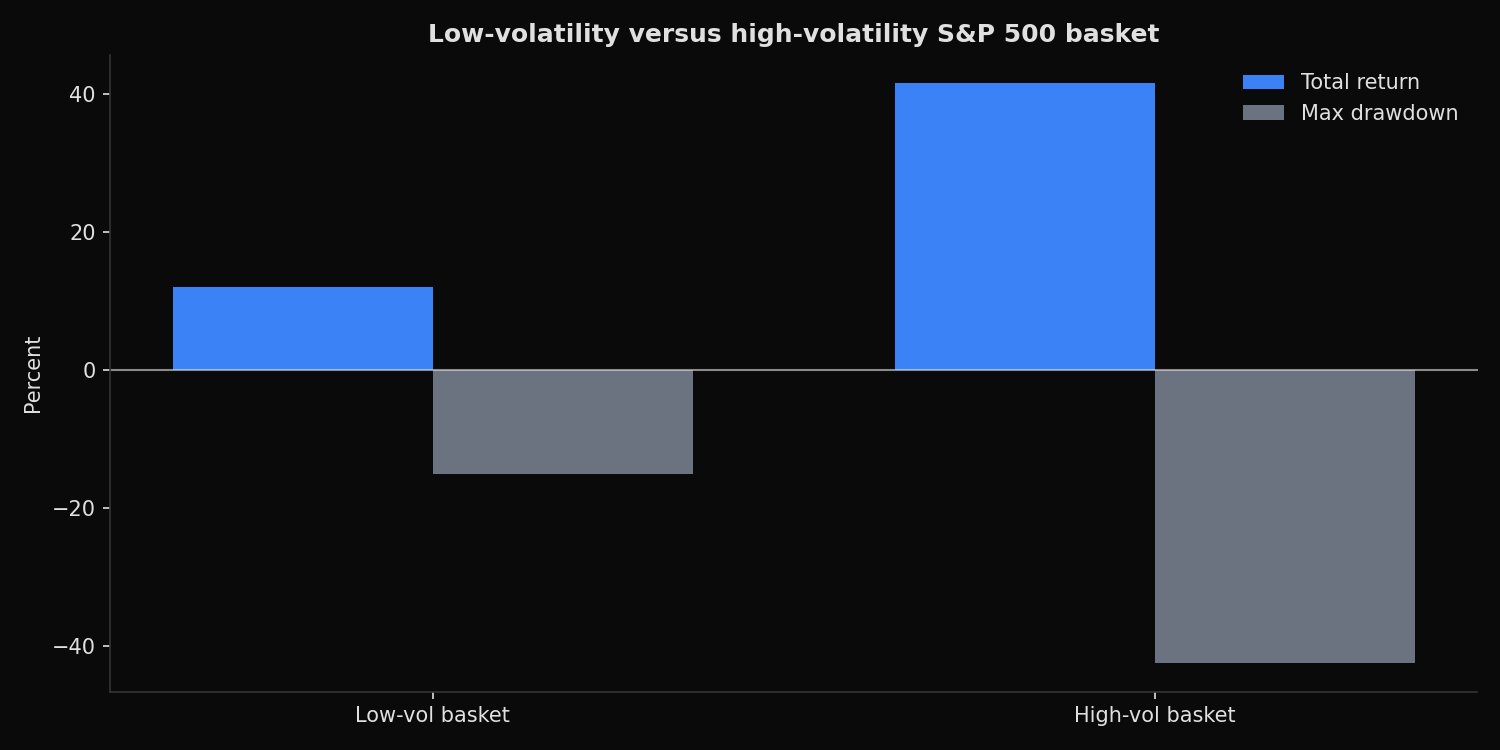
Low-vol basket   volatility=  19.0%  total_return=  12.0%  max_drawdown= -15.1%
High-vol basket  volatility=  46.8%  total_return=  41.5%  max_drawdown= -42.5%

Lowest-volatility stocks:
KO    vol=  16.2%  return=   8.3%  max_drawdown=  -9.2%
MCD   vol=  16.4%  return= -11.7%  max_drawdown= -20.0%
JNJ   vol=  16.8%  return=  48.5%  max_drawdown= -11.0%
LIN   vol=  16.9%  return=   7.9%  max_drawdown= -19.5%
PG    vol=  18.1%  return= -13.5%  max_drawdown= -16.2%
COST  vol=  18.8%  return=  -3.8%  max_drawdown= -16.3%
UNP   vol=  21.3%  return=  19.6%  max_drawdown= -12.3%
JPM   vol=  21.7%  return=  18.7%  max_drawdown= -15.5%
PEP   vol=  21.8%  return=   8.4%  max_drawdown= -17.0%
CVX   vol=  22.2%  return=  37.6%  max_drawdown= -14.0%
What this tells us
The low-volatility basket did reduce drawdown. Its average max drawdown is -15.1%, compared with -42.5% for the high-volatility basket. Realized volatility also separates cleanly: 19.0% for the low-volatility group versus 46.8% for the high-volatility group.
The tradeoff is return. The low-volatility basket returned 12.0%, while the high-volatility basket returned 41.5%. In this sample, riskier stocks were rewarded, but they required much larger drawdown tolerance.
The individual low-volatility list is intuitive. KO, MCD, JNJ, LIN, PG, COST, UNP, JPM, PEP, and CVX include staples, healthcare, industrial, financial, and energy exposure. The factor is not sector-neutral. It naturally tilts away from the most speculative growth names.
So what?
Low volatility is a drawdown-control tool, not a guaranteed return enhancer. It can be valuable when the portfolio objective is smoother compounding, lower risk-budget use, or better behavior in selloffs. It can lag when market leadership rewards high-beta exposure.
For portfolio construction, the factor should be judged against its job. If the mandate is absolute return in a risk-on year, low volatility may disappoint. If the mandate is to keep drawdowns within a defined limit, the low-volatility basket did what it was supposed to do. Whether the instability of volatility adds anything to its level as a drawdown warning is examined in a vol-of-vol sort on index members.
Built with xfinlink — free financial data API for Python.