
Do Oil Stocks Hedge Inflation? Rolling Beta Analysis in Python
May 19, 2026
What’s the question?
The conventional wisdom is that oil stocks are natural inflation hedges — when consumer prices rise, energy companies benefit from higher commodity prices, and their stock returns should compensate for the erosion of purchasing power. If true, the regression beta of oil stock returns against CPI changes should be positive and statistically significant. This article tests whether that claim holds across three major integrated oil companies over 8 years of data.
The approach
Pull monthly CPI (CPIAUCSL) from FRED and monthly returns for XOM, CVX, COP from xfinlink. Run OLS regression of stock returns on CPI month-over-month changes. Compute rolling 24-month betas to test stability.
import xfinlink as xfl
import pandas as pd
import numpy as np
from fredapi import Fred
from scipy import stats

xfl.api_key = "YOUR_API_KEY"  # free at https://xfinlink.com/signup
fred = Fred(api_key=os.environ["FRED_API_KEY"])

# Monthly CPI
cpi = fred.get_series("CPIAUCSL", observation_start="2018-01-01")
cpi_mom = cpi.pct_change().dropna().rename("cpi_change")
cpi_mom.index = cpi_mom.index.to_period("M")

# Monthly stock returns
tickers = ["XOM", "CVX", "COP"]
df = xfl.prices(tickers, start="2018-01-01", fields=["close"])
df["date"] = pd.to_datetime(df["date"])
monthly = df.groupby(["ticker", df["date"].dt.to_period("M")])["close"].last()
returns = monthly.groupby("ticker").pct_change().dropna().rename("ret")
returns = returns.reset_index()

# OLS regression per ticker
for t in tickers:
    tr = returns[returns["ticker"] == t].set_index("date")["ret"]
    merged = pd.concat([tr, cpi_mom], axis=1).dropna()
    slope, intercept, r, p, se = stats.linregress(merged["cpi_change"], merged["ret"])
    # Rolling 24-month beta significance
    rolling_p = merged.rolling(24).apply(
        lambda w: stats.linregress(w.iloc[:, 0], w.iloc[:, 1]).pvalue, raw=False
    )
    sig_pct = (rolling_p["ret"] < 0.10).mean() * 100
    print(f"{t}: full_beta={slope:+.2f} (p={p:.3f}, R²={r**2:.3f}) | sig at 10%: {sig_pct:.0f}%")
Full script with formatting and visualisation: oil-inflation-hedge-beta-python.py
Output:
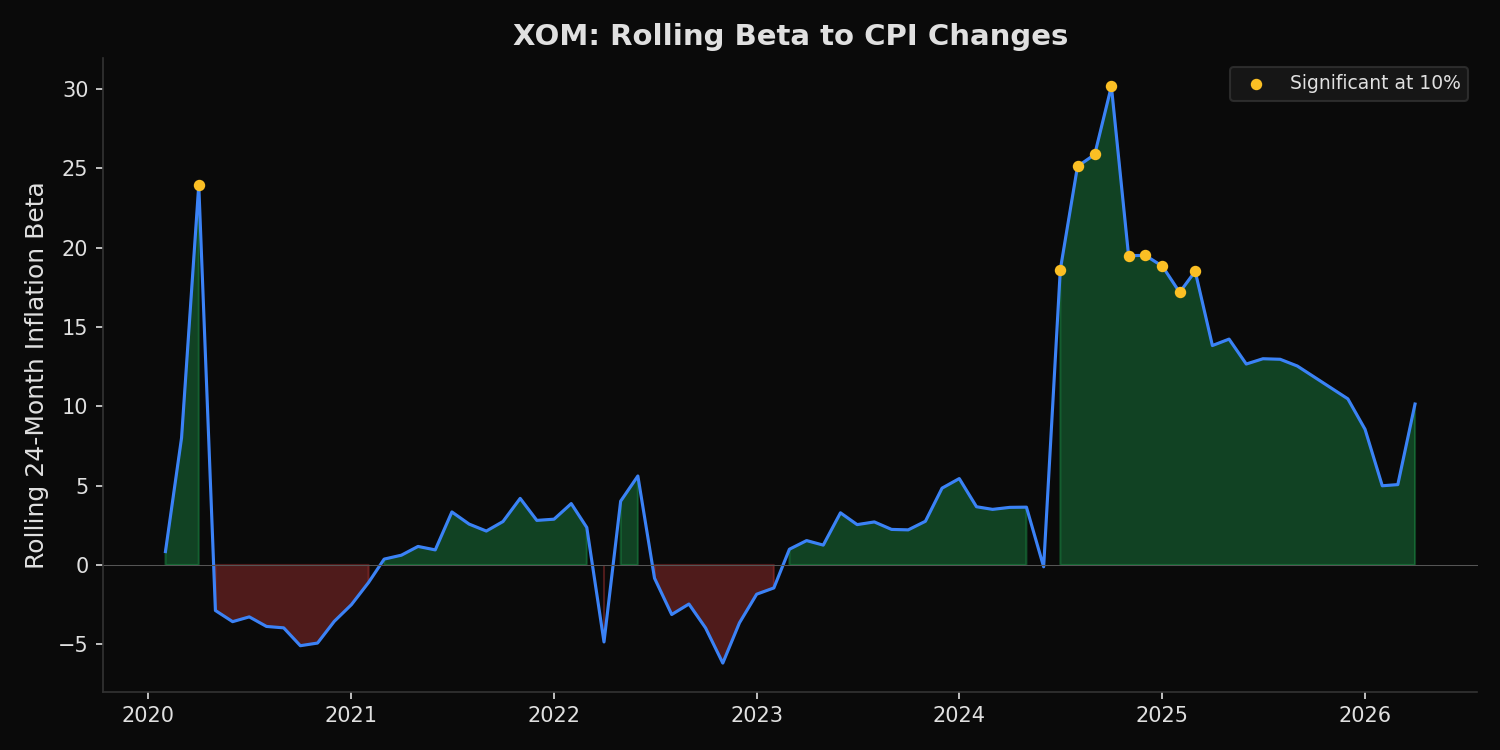
XOM: full_beta=+4.40 (p=0.156, R²=0.021) | rolling median=+2.75, sig at 10%: 14%
CVX: full_beta=+1.91 (p=0.532, R²=0.004) | rolling median=+0.65, sig at 10%: 5%
COP: full_beta=+2.90 (p=0.453, R²=0.006) | rolling median=+0.41, sig at 10%: 5%

Conclusion: inflation betas are UNSTABLE
What this tells us
All three betas are positive — the direction is correct. But none are statistically significant at conventional levels (p = 0.16, 0.53, 0.45). R² values are near zero (0.4-2.1%), meaning CPI changes explain almost none of the variation in oil stock returns. The rolling analysis reveals the real problem: XOM’s beta is significant at the 10% level in only 14% of rolling windows. CVX and COP are significant in only 5%. The inflation hedge property is not just weak — it is unreliable. It appears and disappears depending on the estimation window.
So what?
Oil stocks may provide an indirect hedge against inflation over very long horizons (decades), but they are not reliable hedges at the portfolio-construction timescale (1-3 years). The monthly R² of 2% means 98% of oil stock return variation comes from factors other than consumer prices — supply shocks, OPEC decisions, geopolitical risk, and general equity market movements. Investors seeking explicit inflation protection should consider TIPS, commodities futures, or inflation swaps rather than relying on oil equity exposure.
pip install xfinlink