Which Dividend Stocks Survive a Cash-Flow Stress Test? Dividend Screening in Python
June 12, 2026
What's the question?
Dividend yield is attractive only if the payout is financially supportable. A high yield can mean shareholder income, but it can also mean the market expects a dividend cut. The difference depends on cash generation, leverage, and payout burden.
The practical question is which dividend stocks combine yield with enough cash-flow and balance-sheet support. A simple yield screen cannot answer that question because it rewards high distributions even when free cash flow is weak or leverage is elevated.
The approach
The universe is T, VZ, MO, PM, KO, PEP, PG, WMT, DUK, XOM, and CVX. Built from SEC EDGAR public filings and market data, the screen uses trailing-twelve-month metrics.
- Pull dividend yield, payout ratio, debt/EBITDA, free-cash-flow margin, and P/E ratio
- Standardize each metric across the peer set
- Reward higher yield and higher free-cash-flow margin
- Penalize higher payout ratios and higher leverage
- Rank the stocks by the resulting resilience score
The score is not a prediction that a dividend will be raised or cut. It is a stress screen that separates income from balance-sheet pressure.
Code
import xfinlink as xfl
import pandas as pd

xfl.set_api_key("YOUR_API_KEY")  # free at https://xfinlink.com/signup

tickers = ["T", "VZ", "MO", "PM", "KO", "PEP", "PG", "WMT", "DUK", "XOM", "CVX"]
fields = ["dividend_yield", "dividend_payout_ratio", "debt_to_ebitda", "fcf_margin"]

df = xfl.metrics(tickers, period_type="ttm", fields=fields)
latest = df.sort_values("period_end").groupby("ticker").tail(1).set_index("ticker")

def zscore(s):
    return (s - s.mean()) / s.std(ddof=0)

latest["resilience_score"] = (
    zscore(latest["dividend_yield"])
    - zscore(latest["dividend_payout_ratio"])
    - zscore(latest["debt_to_ebitda"])
    + zscore(latest["fcf_margin"])
)

print(latest.sort_values("resilience_score", ascending=False))
Full script with formatting and visualisation: dividend-cash-flow-stress-python.py
Output
=== Dividend Cash-Flow Stress Screen ===
Latest TTM periods: 2026-03-21 to 2026-04-30
Complete-data universe: 11 dividend stocks
Highest yield: VZ (   5.9%)
Best resilience score: MO ( 2.97)
Weakest resilience score: DUK (-3.95)

Dividend stress ranking:
MO    score=  2.97  yield=   5.9%  payout=  87.7%  debt/EBITDA= 2.13  FCF_margin=  36.8%  PE= 14.9
T     score=  1.79  yield=   4.8%  payout=  37.4%  debt/EBITDA= 3.03  FCF_margin=  13.7%  PE=  7.7
VZ    score=  1.32  yield=   5.9%  payout=  67.3%  debt/EBITDA= 2.99  FCF_margin=  14.6%  PE= 11.4
PG    score=  0.85  yield=   2.8%  payout=  61.8%  debt/EBITDA= 1.59  FCF_margin=  17.3%  PE= 21.7
KO    score=  0.33  yield=   2.5%  payout=  64.8%  debt/EBITDA= 2.53  FCF_margin=  25.5%  PE= 25.9
XOM   score=  0.29  yield=   2.8%  payout=  68.0%  debt/EBITDA= 0.74  FCF_margin=   5.6%  PE= 24.7
PM    score= -0.16  yield=   3.2%  payout=  81.1%  debt/EBITDA= 2.87  FCF_margin=  25.7%  PE= 25.5
WMT   score= -0.20  yield=   0.8%  payout=  34.9%  debt/EBITDA= 1.06  FCF_margin=   1.7%  PE= 42.4
CVX   score= -1.49  yield=   3.7%  payout= 120.4%  debt/EBITDA= 1.10  FCF_margin=   7.4%  PE= 32.4
PEP   score= -1.75  yield=   4.0%  payout=  89.3%  debt/EBITDA= 3.37  FCF_margin=   9.3%  PE= 22.6
DUK   score= -3.95  yield=   3.4%  payout=  65.0%  debt/EBITDA= 4.90  FCF_margin= -10.1%  PE= 19.1
What this tells us
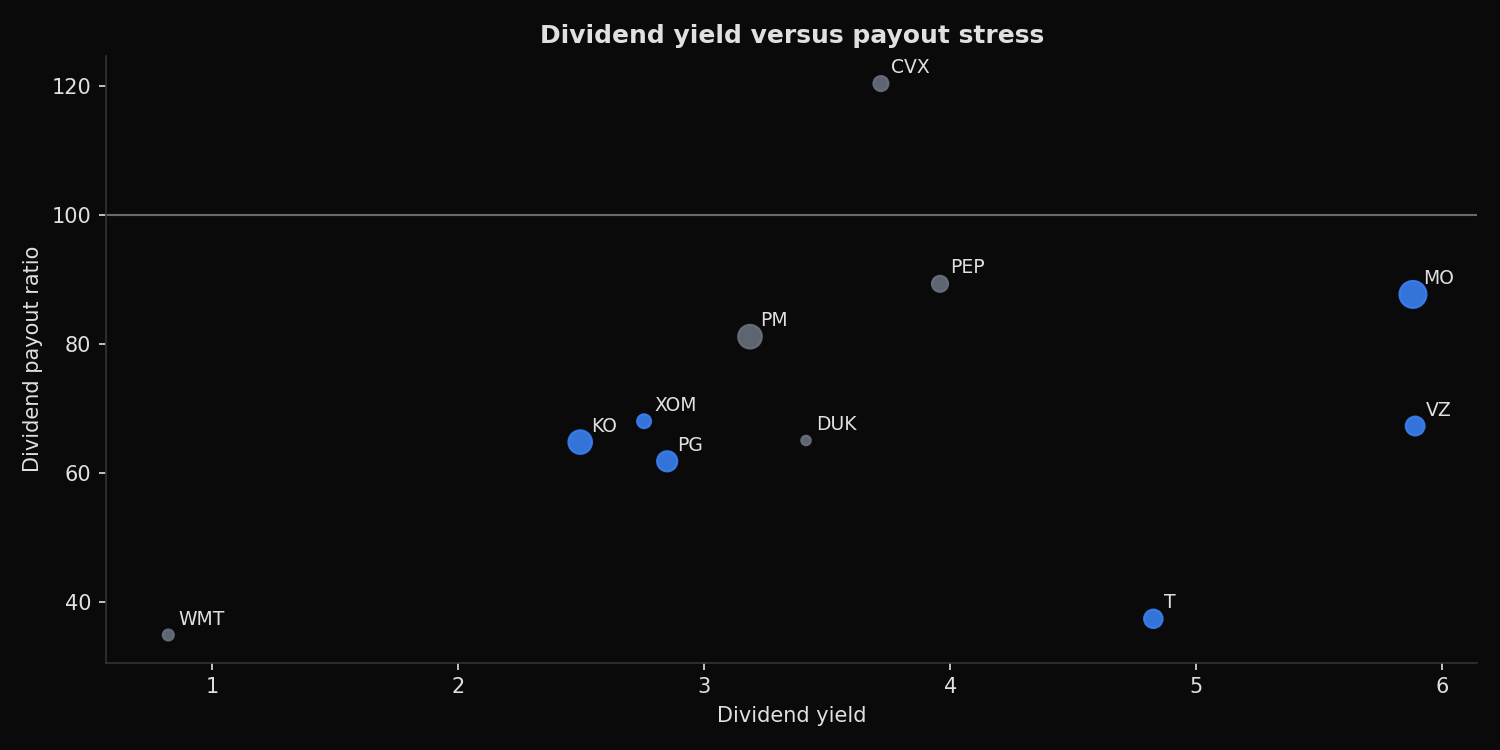
The highest yield does not automatically produce the best stress profile. VZ has the highest yield at 5.9%, but MO ranks first because it combines a similar yield with a 36.8% free-cash-flow margin and lower leverage than several peers. T also ranks well because its payout ratio is only 37.4%, although its leverage is higher than MO's.
DUK ranks weakest. The issue is not the 3.4% yield by itself. The combination of 4.90x debt/EBITDA and a -10.1% free-cash-flow margin makes the dividend less attractive on this stress framework. CVX also scores poorly because the payout ratio is above 100% in the trailing-twelve-month window.
So what?
Dividend screens should begin with yield but not end there. A high yield with strong free-cash-flow margin and manageable leverage can be a useful income candidate. A high yield with weak free cash flow or high leverage is a different exposure: it is partly a credit and payout-risk trade.
The practical rule is simple. Rank yield together with payout, leverage, and free-cash-flow margin. That avoids treating every 4% to 6% yield as equivalent.
Built with xfinlink — free financial data API for Python. pip install -U xfinlink
pip install -U xfinlink