
Trading Days vs Calendar Days: Why 252 Is Only an Average
September 14, 2026
A US equity year holds 252 trading days on average and hardly ever exactly that. Counting the sessions in thirty years of daily bars, 1996 through 2025, the yearly total ran from 248 in 2001 to 254 in 1996 and landed on exactly 252 in 17 of the 30 years. The number 252 is a modelling convention rather than a measurement, and it misleads in two different ways: when it scales a quantity for a year that did not hold 252 sessions, and when it is used to count rows.
How Many Trading Days Are in a Year?
The arithmetic is short. Start with the weekdays in the calendar year, which is 260, 261 or 262 depending on where 1 January falls and whether February has an extra day. Subtract the holidays the exchange observes on a weekday. Subtract anything unscheduled, which is rare and memorable. What remains is the session count, and the only reliable way to get it for a past year is to count the rows.
import numpy as np
import xfinlink as xfl

xfl.set_api_key("YOUR_API_KEY")  # free at https://xfinlink.com/signup

sessions = xfl.prices("SPY", start="1996-01-01", end="2025-12-31", fields=["close"])["date"]

per_year = sessions.groupby(sessions.dt.year).size()
weekdays = {y: int(np.busday_count(f"{y}-01-01", f"{y + 1}-01-01")) for y in per_year.index}

print(per_year.mean(), per_year.min(), per_year.max())
Full script, including the cross-checks and the chart: trading-days-vs-calendar-days.py
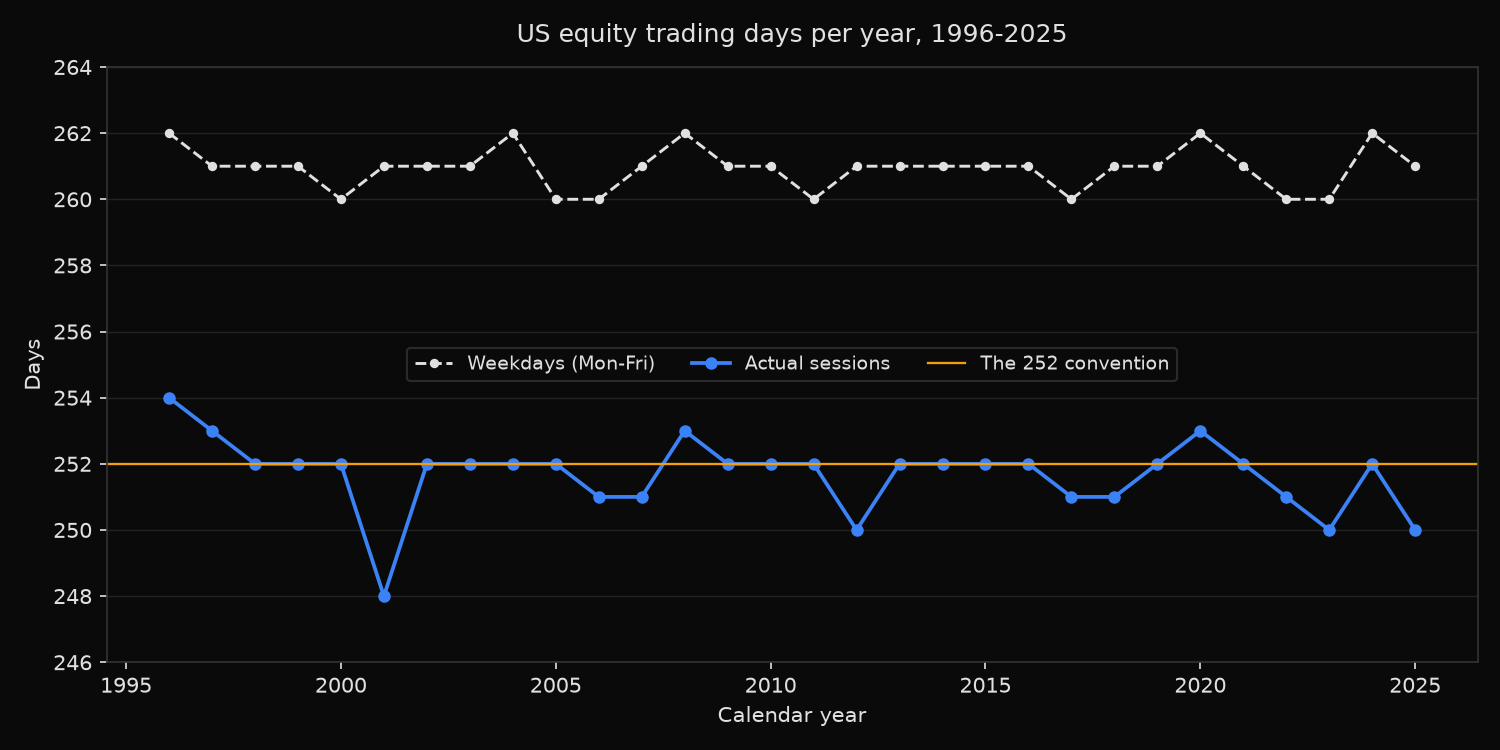
US equity sessions per calendar year, 1996-01-01 to 2025-12-31
Source: daily bars, one row per session. Weekdays = Monday to Friday.

Year   Sessions  Weekdays   Gap   Year   Sessions  Weekdays   Gap
1996        254       262     8   2011        252       260     8
1997        253       261     8   2012        250       261    11
1998        252       261     9   2013        252       261     9
1999        252       261     9   2014        252       261     9
2000        252       260     8   2015        252       261     9
2001        248       261    13   2016        252       261     9
2002        252       261     9   2017        251       260     9
2003        252       261     9   2018        251       261    10
2004        252       262    10   2019        252       261     9
2005        252       260     8   2020        253       262     9
2006        251       260     9   2021        252       261     9
2007        251       261    10   2022        251       260     9
2008        253       262     9   2023        250       260    10
2009        252       261     9   2024        252       262    10
2010        252       261     9   2025        250       261    11

Sessions per year: mean 251.7, median 252, min 248 (2001), max 254 (1996)
Years landing on exactly 252: 17 of 30
Weekdays per year: mean 260.9, min 260, max 262
Window totals: 7,550 sessions against 7,828 weekdays, a difference of 278 days over 30 years

Same session dates across three long-lived listings
  KO      7550 sessions   dates absent vs SPY: 0   dates not in SPY: 0
  JNJ     7550 sessions   dates absent vs SPY: 0   dates not in SPY: 0
  IBM     7550 sessions   dates absent vs SPY: 0   dates not in SPY: 0

The observed-holiday list is not fixed
  Sessions on the third Monday of January: 1996, 1997
  No session on the 19 June observance: 2022, 2023, 2024, 2025

2026 scheduled: 261 weekdays minus 10 published holidays = 251 sessions

Day after Thanksgiving (an early close), SPY volume against that year's median session
  2015 0.33x   2016 0.41x   2017 0.43x   2018 0.52x   2019 0.56x   2020 0.38x
  2021 1.73x   2022 0.35x   2023 0.38x   2024 0.57x   2025 0.72x
  Below the year's median in 10 of 11 years; mean 0.58x

What the gap does to an annualisation factor
  sqrt(251.7) = 15.864    sqrt(260.9) = 16.153
  15% annualised on the session count becomes 15.27% on the weekday count  (+0.27%)
  20% annualised on the session count becomes 20.36% on the weekday count  (+0.36%)
  30% annualised on the session count becomes 30.55% on the weekday count  (+0.55%)
Coca-Cola, Johnson & Johnson and IBM return the same 7,550 dates as SPY, with no date present in one series and absent from another, so the calendar above is a property of the market rather than of one listing.
Why the Count Moves from Year to Year
Four separate mechanisms push it around, and they do not cancel.
The first is where the fixed-date holidays fall. New Year’s Day, Independence Day and Christmas move across the week, and a Saturday date can remove the holiday altogether. The New York Stock Exchange states the rule plainly in the footnote to its own calendar: “Because the holiday falls on Saturday, January 1, 2028, no New Year’s Day holiday is observed” (nyse.com/trade/hours-calendars, checked 14 September 2026). The data agrees for the earlier instances of the same alignment. Friday 31 December 1999, and the same date in 2004, 2010 and 2021, are all full sessions in the series, which is why 2000, 2005, 2011 and 2022 each carry only 260 weekdays yet still reach 252, 252, 252 and 251 sessions.
The second is that the list of observed holidays is itself not fixed. The series contains a session on the third Monday of January in 1996 and 1997 and in no year after that. The June observance disappears from 2022 onward. The exchange’s current list runs to ten names, Martin Luther King, Jr. Day and Juneteenth National Independence Day included (nyse.com/trade/hours-calendars, checked 14 September 2026). A study spanning 1996 to today is therefore counting against a moving definition, and an annualisation factor calibrated on recent years is slightly wrong for the older part of the same sample.
Third, closures happen. The four sessions from 11 to 14 September 2001 are absent from the series and produce the lowest count in the window at 248. Two more are missing on 29 and 30 October 2012, when Hurricane Sandy shut the market. Single days are gone on 11 June 2004, 2 January 2007, 5 December 2018 and 9 January 2025, each a national day of mourning, which is why those four years sit one session below the arithmetic their weekday count implies.
Fourth, and least interesting, the calendar year itself is 260, 261 or 262 weekdays long.
What a Business-Day Date Range Misses
Generating dates with a rule is the common shortcut, and the standard rule knows about weekends only. The pandas offset alias table defines B as “business day frequency” and C as “custom business day frequency”, and the explanation of the second makes the boundary explicit: “The CDay or CustomBusinessDay class provides a parametric BusinessDay class which can be used to create customized business day calendars which account for local holidays and local weekend conventions” (pandas.pydata.org, checked 14 September 2026). The plain business-day range accounts for none.
Applied to 2025 that produces 261 dates against 250 actual sessions. Reindexing a price series onto those dates and forward-filling inserts eleven flat rows carrying a zero return, each one sitting on a day the market was shut. Reindexing without filling inserts eleven gaps that every downstream calculation then has to handle. Across the full thirty years the excess runs to 278 days, a little over nine a year, and it lands on holidays rather than scattering evenly.
The maintainers of pandas_market_calendars built a package for this, and their own description of the problem is accurate: pandas “includes excellent functionality for generating sequences of dates and capabilities for custom holiday calendars, but as an explicit design choice it does not include the actual holiday calendars for specific exchanges or OTC markets” (pandas-market-calendars.readthedocs.io, checked 14 September 2026). The same page describes the package as providing “access to over 50+ unique exchange calendars for global equity and futures markets”, and for anyone who must know in advance whether a future date is a session, that is the right tool.
For historical work the reconstruction is unnecessary. A daily series returns one row per session, so the index of the frame that comes back already is the exchange calendar for the period requested. Counting len(df) answers the question that a generated date range only approximates.
Which Unit of Time Should You Count In?
| Unit | What it counts | Typical year | Use it for |
|---|---|---|---|
| Calendar days | Every day | 365 or 366 | Interest accrual, filing deadlines, holding periods for tax |
| Weekdays | Monday to Friday | 260 to 262 | Nothing in market data |
| Business-day range | Weekdays, by rule | 260 to 262 | Scheduling, where a wrong day is harmless |
| Exchange sessions | Days the market opened | 248 to 254 | Returns, volatility, lookbacks, event windows |
| The 252 convention | An agreed constant | 252 | Quoting an annualised figure so it compares to others |
The last row is not a mistake. A volatility figure annualised on 252 compares against every other figure annualised on 252, and swapping in the true count for each year produces numbers that agree with nobody. The constant only becomes an error when it is used to count rows rather than to scale a quantity.
Where the Difference Actually Costs Something
For annualising volatility the gap is small and worth knowing. The square root of 251.7 is 15.864 against 16.153 for the weekday count, so a 20 percent annualised volatility computed on the wrong factor is quoted as 20.36 percent. That is noise next to the estimation error on the volatility itself.
Row counting is where it turns expensive. A lookback defined as “the last 252 rows” reaches back exactly one year in a 252-session year and further than that in every short one: 2001 held 248 sessions, 2012, 2023 and 2025 held 250 each. Rebalance on that rule at a fixed monthly date and the formation window drifts against the calendar, which matters for anything compared against a published series. An event window of 20 sessions around an announcement spans a different number of calendar days depending on where the holidays sit, so measuring the window in trading days and reporting it in calendar days is a common and avoidable confusion. The same discipline underlies running an event study in Python and the broader question of what data a backtest requires.
The practical rule is short. Scale with 252 when quoting a number for comparison. Count with the rows when selecting a window, and let the data supply the calendar.
FAQ
How many trading days are in 2026? 251 scheduled sessions: 261 weekdays minus the ten holidays the exchange publishes for the year. Two of those 251 are shortened rather than full. The NYSE calendar states that “Each market will close early at 1:00 p.m. (1:15 p.m. for eligible options) on Friday, November 27, 2026” and again on “Thursday, December 24, 2026” (nyse.com/trade/hours-calendars, checked 14 September 2026).
Does a half day count as a trading day? Yes. An early close is a session and produces one daily bar like any other, so nothing in a daily series marks it. Volume does. SPY traded at 0.58 times the year’s median session volume on the day after Thanksgiving, averaged over 2015 to 2025, and below the median in 10 of those 11 years. The exception is 2021, at 1.73 times: a shortened session is still a session, and it absorbs whatever arrives during it.
Is 252 wrong, then? No, it is a convention that is right about 57 percent of the time and never off by more than four days in the last thirty years. Use it for annualising. Do not use it to decide how many rows make a year, and do not assume two data sources counted the same sessions before comparing their volatility figures. Related reading on the arithmetic of annualising: log returns vs simple returns.
Where do the sessions come from? Daily bars in the xfinlink API carry one row per session, so the session calendar for any window is the frame that comes back. A free key covers the most recent twelve months, which is enough to count a year and check it against the exchange calendar; longer histories go with the paid plans listed on pricing.
Built with xfinlink — free financial data API for Python. pip install -U xfinlink
pip install -U xfinlink