BLOG

Behind the numbers.

Code examples, market analysis, and data quality deep-dives.

Can Risk Parity Reduce Mega-Cap Drawdowns? Portfolio Optimization in Python
Which Growth Stocks Are Self-Funding? Cash-Flow Quality Screening in Python
Which Sectors Struggle When the Dollar Rallies? Sector Rotation Analysis in Python
Do Cheap Stocks Hold Up When Bonds Sell Off? Valuation Rotation in Python
Does the Nasdaq 100 Have Better Growth Quality Than the Dow? Index Constituent Analysis in Python
Do Healthcare Cash-Flow Margins Predict Returns? Signal Evaluation in Python
Which Dividend Stocks Survive a Cash-Flow Stress Test? Dividend Screening in Python
Does Heavy Insider Selling Predict Weak Returns? Insider Flow Test in Python
Can Quality Screens Reduce Small-Cap Balance-Sheet Risk? Russell 2000 Test in Python
Which Retailers Have Positive Operating Leverage? Margin Screening in Python
Is MSTR a Leveraged Bitcoin Proxy? Rolling Beta Analysis in Python
Is Micron's Memory Cycle Recovering? Inventory and Margin Forecasting in Python
Which Sectors Work When Bonds Rally? Rate-Sensitive Rotation in Python
Do One-Month Price Extremes Reverse? Signal Evaluation in Python
Do Low-Volatility S&P 500 Stocks Reduce Drawdowns? Factor Test in Python
Is AI Capex Paying Back Fast Enough? Revenue Hurdle Forecasting in Python
Could Shorter AI Asset Lives Hit Earnings? Depreciation Stress Test in Python
How Much AI Capex Risk Can a Portfolio Remove? Constrained Optimization in Python
Is the AI Capex Trade Crowded? Rolling Volatility and Sector Rotation in Python
Did the AI Boom Come From Existing S&P 500 Members? Point-in-Time Momentum Test in Python
Is AI Revenue Circular? Customer-Vendor Capex Loop Analysis in Python
Is the AI Trade Connected to Private Credit? Rolling Correlation Network in Python
Is Apollo More Balance-Sheet Sensitive Than Peers? Leverage Screen in Python
Are AI Earnings Supported by Cash Flow? Accrual and Capex Screen in Python
Can Defensive Stocks Hedge AI Drawdowns? Basket Regime Test in Python
How Fast Does the Market Price In Fed Decisions? FOMC Event Study in Python
How Much Are Options Sellers Overpaid? The Variance Risk Premium in Python
Which Companies Have the Worst Earnings Quality? Sloan Accrual Screen with Geographic Revenue Data in Python
Does the Oil-to-Gold Ratio Signal Recessions? XLE/GLD Backtest in Python
Is AI Spending Crowding Out Free Cash Flow? Capex Sustainability Across the Mag 7 in Python
Does a Long Energy / Short Bonds Portfolio Capture Inflation Surprises? Factor Construction in Python
Can a Hidden Markov Model Detect Oil Market Regimes? HMM Analysis in Python
Do Grain Prices Predict Food Inflation? Granger Causality Test in Python
Does the Corporate Credit Spread Predict Stock Market Crashes? BAA-AAA Spread Analysis in Python
Do Oil Stocks Hedge Inflation? Rolling Beta Analysis in Python
Which Stocks Are Most Rate-Sensitive? Equity Duration via Bond Beta in Python
Which Companies Have the Highest Accrual Ratios? Earnings Quality Screening in Python
Is Alpha Persistent or Decaying? Rolling Sharpe Ratio Analysis in Python
Are Markets Trending or Mean-Reverting? Hurst Exponent Analysis in Python
Is Consumer Discretionary vs Staples a Leading Indicator? XLY/XLP Ratio Analysis in Python
Does Heavy Capex Predict Future Stock Returns? Capital Expenditure Analysis in Python
How to Estimate Cost of Equity Using CAPM in Python
Is Volatility Predictable? Testing for Volatility Clustering in Python
Which Industrials Are Overleveraged? Net Debt to EBITDA Screening in Python
GM Before and After Bankruptcy: Why Entity Resolution Matters for Financial Data
What Is Adjusted Beta? Merrill Lynch Beta Shrinkage in Python
How Good Is a Stock Pick? Information Ratio and Tracking Error in Python
Do Stock Returns Follow a Normal Distribution? Testing for Fat Tails in Python
Which Large Caps Have the Highest Free Cash Flow Yield? FCF Screening in Python
Which Sectors Won Over 5 Years? Sector Rotation Analysis in Python
How to Forecast Stock Volatility with GARCH Models in Python
Are Stock Prices Mean-Reverting? Augmented Dickey-Fuller Test in Python
How to Calculate CAPM Alpha and Beta with Regression in Python
How to Compare Sector Sharpe Ratios and Sortino Ratios in Python
DELL: Why Stitching Historical Price Data Together Is Wrong
How to Analyze Drawdown and Recovery for Bank Stocks in Python
How to Screen SaaS Stocks by Revenue Growth and Cash Flow in Python
How to Screen REITs by Dividend Yield and Valuation in Python
How Correlated Are the Magnificent 7? Intra-Group Correlation in Python
AAPL vs XOM: Do Individual Stocks Have Seasonal Patterns?
How to Rank Large-Cap Stocks by Momentum in Python
How to Build a Multi-Endpoint Financial Dashboard in Python
How to Compare Volatility Across Energy Stocks in Python
How to Screen Healthcare Stocks by Valuation in Python
How to Build a Sector Correlation Matrix for Portfolio Diversification in Python
How to Find Oversold and Overbought Stocks Using Z-Scores in Python
How to Measure Earnings Quality: Cash Flow vs Net Income in Python
How to Build a Multi-Factor Stock Screen in Python (Value + Momentum + Quality)
How to Build a Simple DCF Model for Any Stock in Python
How to Screen Tech Stocks by Revenue Growth in Python
How to Screen Stocks by Balance Sheet Health in Python
Is "Sell in May" Real? SPY Monthly Seasonality Over 10 Years
How to Compare Sector Performance YTD Using Python
How to Track S&P 500 Additions and Removals Over Time in Python
How to Screen Dividend Stocks by Yield and Quality in Python
How to Calculate Max Drawdown and Recovery Time for Any Stock in Python
How to Compare Profitability Across Mega-Cap Tech Stocks in Python
Why Ticker Symbols Are Unreliable: The Recycling Problem Every Quant Should Know
How to Calculate and Compare Stock Volatility in Python
How to Screen Blue-Chip Stocks by P/E Ratio in Python
How to Track Companies Through Ticker Changes, Bankruptcies, and Renames in Python
S&P 500 Turnover: How Much the Index Has Changed Since 2010
How to Calculate Stock Beta and Correlation in Python
← All articles

Which Growth Stocks Are Self-Funding? Cash-Flow Quality Screening in Python

What's the question?

Growth is more durable when it is internally funded. A company that can expand revenue while also producing free cash flow has more strategic flexibility than a company that relies on external financing. Free cash flow is cash from operations after capital spending, so it captures whether growth is consuming or producing cash.

The question is which large technology and platform companies combine revenue growth with cash-flow quality. Revenue growth alone is not enough. A fast-growing company with negative free-cash-flow margin may still be valuable, but it carries a different financing profile from a company that grows while generating cash.

The approach

The universe is AAPL, MSFT, NVDA, AMZN, META, GOOG, AVGO, CRM, ORCL, ADBE, AMD, and QCOM. Built from SEC EDGAR public filings and market data, the screen uses latest trailing-twelve-month metrics.

  1. Pull revenue growth, gross margin, free-cash-flow margin, cash-to-debt, P/E ratio, and market capitalization
  2. Standardize each metric across the peer group using z-scores
  3. Reward higher revenue growth, higher free-cash-flow margin, higher gross margin, and more cash relative to debt
  4. Penalize higher P/E ratios
  5. Rank the companies by the resulting self-funding growth score

The score is a cross-sectional screen. It is not a valuation model and it does not estimate intrinsic value.

Code

import xfinlink as xfl
import pandas as pd

xfl.set_api_key("YOUR_API_KEY")  # free at https://xfinlink.com/signup

tickers = ["AAPL", "MSFT", "NVDA", "AMZN", "META", "GOOG", "AVGO", "CRM", "ORCL", "ADBE", "AMD", "QCOM"]
fields = ["market_cap", "revenue_growth", "gross_margin", "fcf_margin", "cash_to_debt", "pe_ratio"]
df = xfl.metrics(tickers, period_type="ttm", fields=fields)
latest = df.sort_values("period_end").groupby("ticker").tail(1).dropna()

def zscore(s):
    return (s - s.mean()) / s.std(ddof=0)

latest["quality_score"] = (
    zscore(latest["revenue_growth"])
    + zscore(latest["fcf_margin"])
    + 0.5 * zscore(latest["gross_margin"])
    + 0.5 * zscore(latest["cash_to_debt"].clip(0, 10))
    - 0.25 * zscore(latest["pe_ratio"].clip(1, 100))
)

print(latest.sort_values("quality_score", ascending=False))

Full script with formatting and visualisation: self-funding-growth-quality-python.py

Output

Self-funding growth quality screen comparing revenue growth and free-cash-flow margin
=== Self-Funding Growth Quality Screen ===
Universe: 11 large-cap technology and platform stocks
Latest TTM period range: 2026-02-27 to 2026-05-03
Top score: NVDA ( 4.41)
Weakest score: ORCL (-3.27)

Self-funding growth ranking:
NVDA  score=  4.41  rev_growth=  70.7%  FCF_margin=  47.0%  cash/debt= 1.56  PE= 31.4  market_cap=$4,966B
ADBE  score=  1.36  rev_growth=  11.0%  FCF_margin=  42.2%  cash/debt= 1.11  PE= 11.9  market_cap=$83B
AMD   score=  0.95  rev_growth=  35.0%  FCF_margin=  22.9%  cash/debt= 5.20  PE=167.7  market_cap=$834B
AVGO  score=  0.87  rev_growth=  30.0%  FCF_margin=  43.4%  cash/debt= 0.30  PE= 63.6  market_cap=$1,818B
META  score=  0.75  rev_growth=  26.2%  FCF_margin=  22.4%  cash/debt= 0.40  PE= 20.6  market_cap=$1,437B
MSFT  score=  0.45  rev_growth=  17.9%  FCF_margin=  22.9%  cash/debt= 2.41  PE= 23.3  market_cap=$2,903B
GOOG  score= -0.95  rev_growth=  17.5%  FCF_margin=  15.2%  cash/debt= 0.49  PE= 27.4  market_cap=$4,358B
AAPL  score= -1.17  rev_growth=  12.8%  FCF_margin=  28.6%  cash/debt= 0.60  PE= 35.2  market_cap=$4,270B
QCOM  score= -1.32  rev_growth=   5.2%  FCF_margin=  28.1%  cash/debt= 0.36  PE= 22.7  market_cap=$224B
AMZN  score= -2.08  rev_growth=  14.2%  FCF_margin=  -0.3%  cash/debt= 0.85  PE= 28.5  market_cap=$2,565B
ORCL  score= -3.27  rev_growth=  14.9%  FCF_margin= -38.6%  cash/debt= 0.73  PE= 33.1  market_cap=$529B

What this tells us

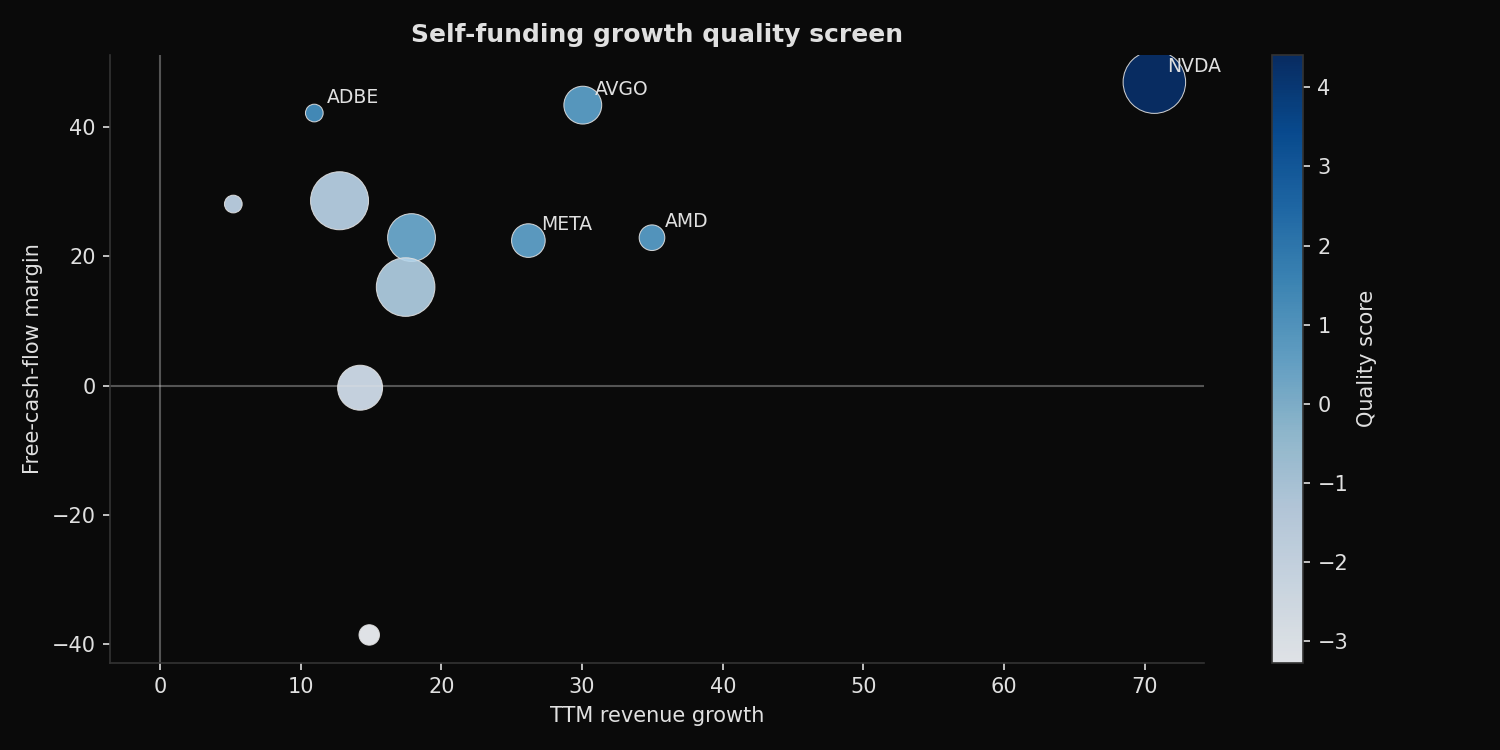
NVDA ranks first by a wide margin because it combines 70.7% revenue growth with a 47.0% free-cash-flow margin and a positive cash-to-debt ratio. That is the rare combination the screen is designed to find: high growth and strong cash generation at the same time.

ADBE ranks second despite only 11.0% revenue growth because its cash-flow profile is strong and its P/E ratio is low relative to the group. AMD and AVGO also score well, but for different reasons. AMD has faster growth and a strong cash-to-debt ratio, while AVGO has a high free-cash-flow margin.

The bottom of the screen is driven by weak cash conversion. AMZN has positive revenue growth but near-zero free-cash-flow margin. ORCL has positive revenue growth but a negative free-cash-flow margin in this trailing-twelve-month window.

So what?

Self-funding growth screens are useful when the research objective is quality, not just speed. They help separate companies that are growing because they have powerful economics from companies that are growing while absorbing cash.

The next step is not automatically buying the top-ranked stocks. A high score should trigger deeper work on durability: customer demand, capital intensity, competitive position, and valuation. A low score should trigger a financing review. Growth that requires persistent cash outflow can still work, but the hurdle rate is higher.

Built with xfinlink — free financial data API for Python. pip install xfinlink

Built with xfinlink — free financial data API for Python. pip install xfinlink
← All articles