
Is the AI Trade Connected to Private Credit? Rolling Correlation Network in Python
May 31, 2026
What's the question?
The AI boom and private credit expansion are often discussed as separate market stories. The first is about infrastructure demand, semiconductor revenue, and cloud spending. The second is about asset managers, credit origination, and insurance-linked capital. The risk question is whether public markets already treat them as one trade.
Correlation measures how two return series move together. A correlation of 1.0 means they move in the same direction with the same pattern. A correlation near zero means their daily movements are mostly unrelated. Correlation cannot prove a balance-sheet connection, but it can show whether investors are pricing two groups as part of the same risk cluster.
The approach
The analysis compares two baskets over two years of daily returns. The AI basket is NVDA, ORCL, MSFT, AMZN, and META. The private-credit and alternative-asset-manager basket is APO, KKR, BX, ARES, and BAM. SPY is included as the broad-market control.
- Pull two years of daily closing prices and returns
- Compute full-period correlations within the AI basket, within the private-credit basket, across the two baskets, and against SPY
- Compute a rolling 60-day AI/private-credit cross-correlation
- Estimate private-credit betas to both NVDA and SPY
The test asks whether the linkage is stronger than ordinary equity-market exposure.
The return series uses the split-aware daily return field, with a guardrail for isolated discontinuities: when the reported daily return is above 50% but the close-to-close move is below 20%, the close-to-close return is used instead. This prevents a single bad return observation from dominating the correlation matrix.
Code
import xfinlink as xfl
import pandas as pd
import numpy as np

xfl.set_api_key("YOUR_API_KEY")  # free at https://xfinlink.com/signup

ai = ["NVDA", "ORCL", "MSFT", "AMZN", "META"]
private_credit = ["APO", "KKR", "BX", "ARES", "BAM"]
tickers = ai + private_credit + ["SPY"]

df = xfl.prices(tickers, period="2y", fields=["close", "return_daily"])
prices = (
    df.pivot_table(index="date", columns="ticker", values="close")
    .dropna(subset=tickers)
)
api_returns = (
    df.pivot_table(index="date", columns="ticker", values="return_daily")
    .reindex(prices.index)
)
close_returns = prices[tickers].pct_change()
returns = api_returns[tickers].copy()
bad_returns = (returns.abs() > 0.50) & (close_returns.abs() < 0.20)
returns = returns.mask(bad_returns, close_returns).dropna()

corr = returns[tickers].corr()
cross_corr = corr.loc[ai, private_credit].to_numpy().mean()
ai_corr = corr.loc[ai, ai].where(np.triu(np.ones((5, 5)), 1).astype(bool)).stack().mean()
private_corr = corr.loc[private_credit, private_credit].where(
    np.triu(np.ones((5, 5)), 1).astype(bool)
).stack().mean()

print(ai_corr, private_corr, cross_corr)
Full script with formatting and visualisation: ai-private-credit-correlation-network-python.py
Output
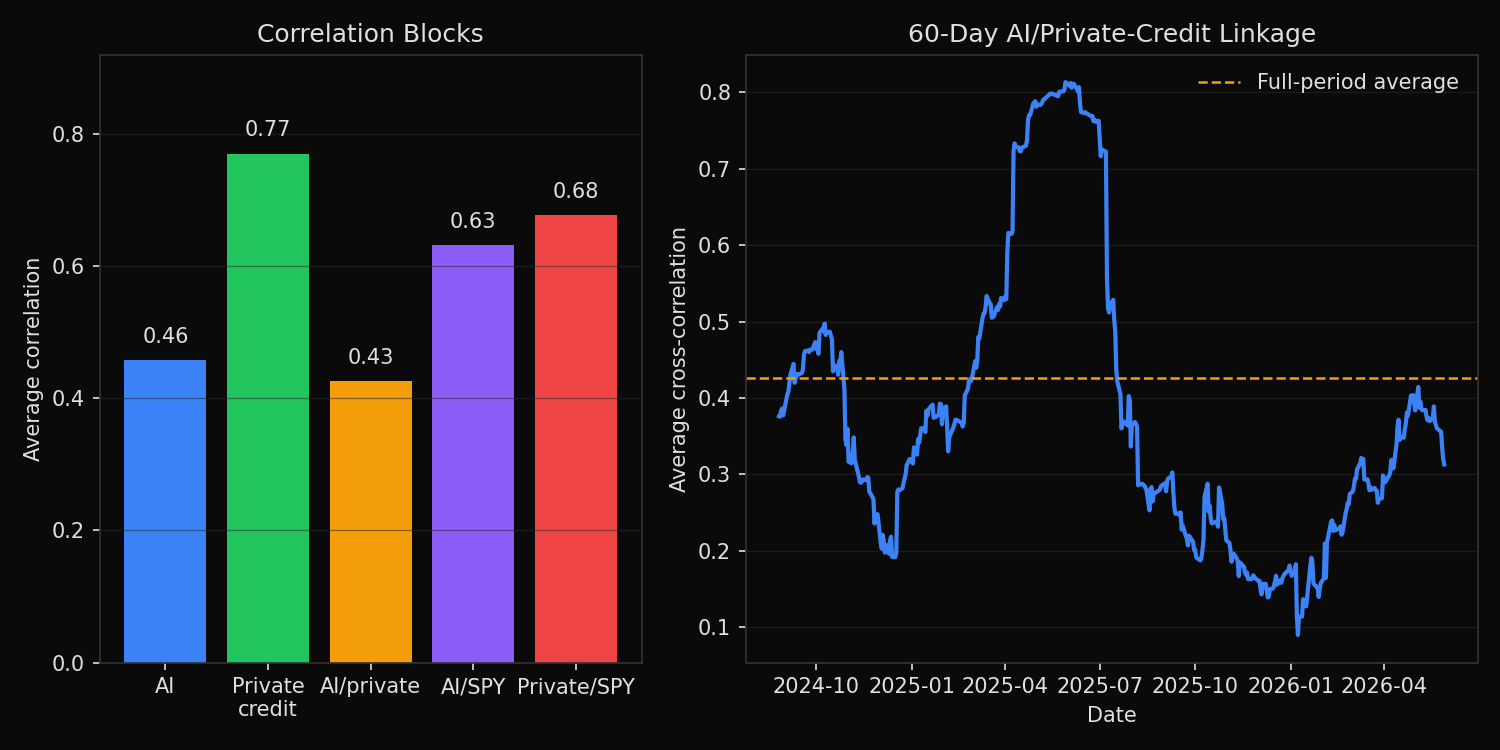
=== AI vs Private-Credit Market Linkage ===
Sample: 2024-05-31 to 2026-05-29 (499 trading days)

Average daily return correlations:
Intra-AI basket:             0.458
Intra-private-credit basket: 0.770
AI / private-credit cross:   0.426
AI / SPY average:            0.631
Private credit / SPY average:0.677

Latest 60-day AI/private-credit cross-correlation: 0.313
Median 60-day cross-correlation:                  0.340

Highest AI/private-credit pair correlations:
AMZN / KKR : 0.496
AMZN / APO : 0.489
AMZN / BAM : 0.470
AMZN / ARES: 0.462
NVDA / BAM : 0.450

Private-credit beta estimates:
KKR  beta_to_NVDA=0.39  beta_to_SPY=1.75
ARES beta_to_NVDA=0.37  beta_to_SPY=1.60
APO  beta_to_NVDA=0.35  beta_to_SPY=1.59
BX   beta_to_NVDA=0.31  beta_to_SPY=1.48
BAM  beta_to_NVDA=0.29  beta_to_SPY=1.28
What this tells us
The two themes are connected at the public-equity level. The AI/private-credit cross-correlation is 0.426, close to the intra-AI correlation of 0.458 and below the intra-private-credit correlation of 0.770. The private-credit basket is the more internally cohesive group. These stocks trade together strongly, and their daily returns are also meaningfully linked to the AI basket.
The broad market explains a large part of the connection. AI stocks have an average correlation of 0.631 with SPY, and private-credit stocks have an average correlation of 0.677 with SPY. The beta estimates reinforce this point. KKR, ARES, APO, BX, and BAM all have much higher betas to SPY than to NVDA. Their public equity risk is more market-beta sensitive than chip-cycle sensitive.
The rolling measure weakens the strongest version of the linkage claim. The latest 60-day cross-correlation is 0.313, below the full-period average and below the 60-day median of 0.340. Recent market pricing does not show a rising convergence between the two baskets.
So what?
The public-market evidence supports a meaningful linkage, but it does not reduce the two baskets to a single hidden factor. A portfolio that owns both AI infrastructure winners and private-credit asset managers is not fully diversified, because both groups retain equity beta. But the private-credit names are still more exposed to broad market risk than to NVDA specifically.
For risk management, the practical approach is to monitor cross-correlation as a regime signal. If the rolling AI/private-credit correlation rises toward the intra-private-credit correlation, diversification is deteriorating and factor exposure should be reduced. At 0.313 today, the connection is visible but not dominant.
Built with xfinlink — free financial data API for Python. pip install xfinlink
pip install xfinlink