
What’s the question?
Net income is an accounting figure. Free cash flow is money in the bank. Over a long horizon the two track each other, but in any single year they can pull apart, and the gap is where a lot of investment risk sits unnoticed. The step before capital spending, operating cash flow against net income, is the measure used in an earnings quality screen.
Free cash flow is the cash a business produces from operations after the capital spending needed to run and grow it: operating cash flow minus capital expenditure. Cash conversion expresses that number against reported profit. A company that books a dollar of net income and produces a dollar of free cash flow converts at 100 percent. Below that level, some of the profit is locked up in working capital or has gone into building factories, warehouses, and data centres. It is real profit by the rules of accounting, but it is not yet cash the owners can use.
The practical question follows directly. When a company posts strong earnings, how much of that profit can actually fund dividends, buybacks, or the next project without borrowing? The answer separates two businesses that look identical on a price-to-earnings screen.
The approach
The sample is sixteen large companies from outside the financial sector, chosen for size and sector spread. Banks and insurers are excluded because capital expenditure and free cash flow do not describe how they work.
For each company the analysis pulls the last three annual filings, keeps the most recent completed fiscal year, and computes two ratios: free cash flow as a share of revenue (the margin), and free cash flow as a share of net income (the conversion). Fiscal years end on different dates across the group, from Apple’s September close to Procter and Gamble’s June one, so each figure is that company’s own latest full year rather than a common calendar period.
Code
import pandas as pd
import xfinlink as xfl

xfl.set_api_key("YOUR_API_KEY")  # free at https://xfinlink.com/signup

tickers = ["AAPL", "MSFT", "NVDA", "GOOGL", "AMZN", "JNJ", "XOM", "PG",
           "KO", "HD", "WMT", "UNH", "COST", "MRK", "ORCL", "CSCO"]

f = xfl.fundamentals(tickers, period_type="annual", period="3y",
                     fields=["revenue", "net_income", "free_cash_flow"])

latest = f.sort_values("period_end").groupby("ticker", as_index=False).last()
latest["fcf_margin"] = latest["free_cash_flow"] / latest["revenue"] * 100
latest["cash_conversion"] = latest["free_cash_flow"] / latest["net_income"] * 100

print(latest.sort_values("cash_conversion", ascending=False)
            [["ticker", "fcf_margin", "cash_conversion"]].to_string(index=False))
Full script with formatting and visualisation: free-cash-flow-conversion-megacaps-python.py
Output
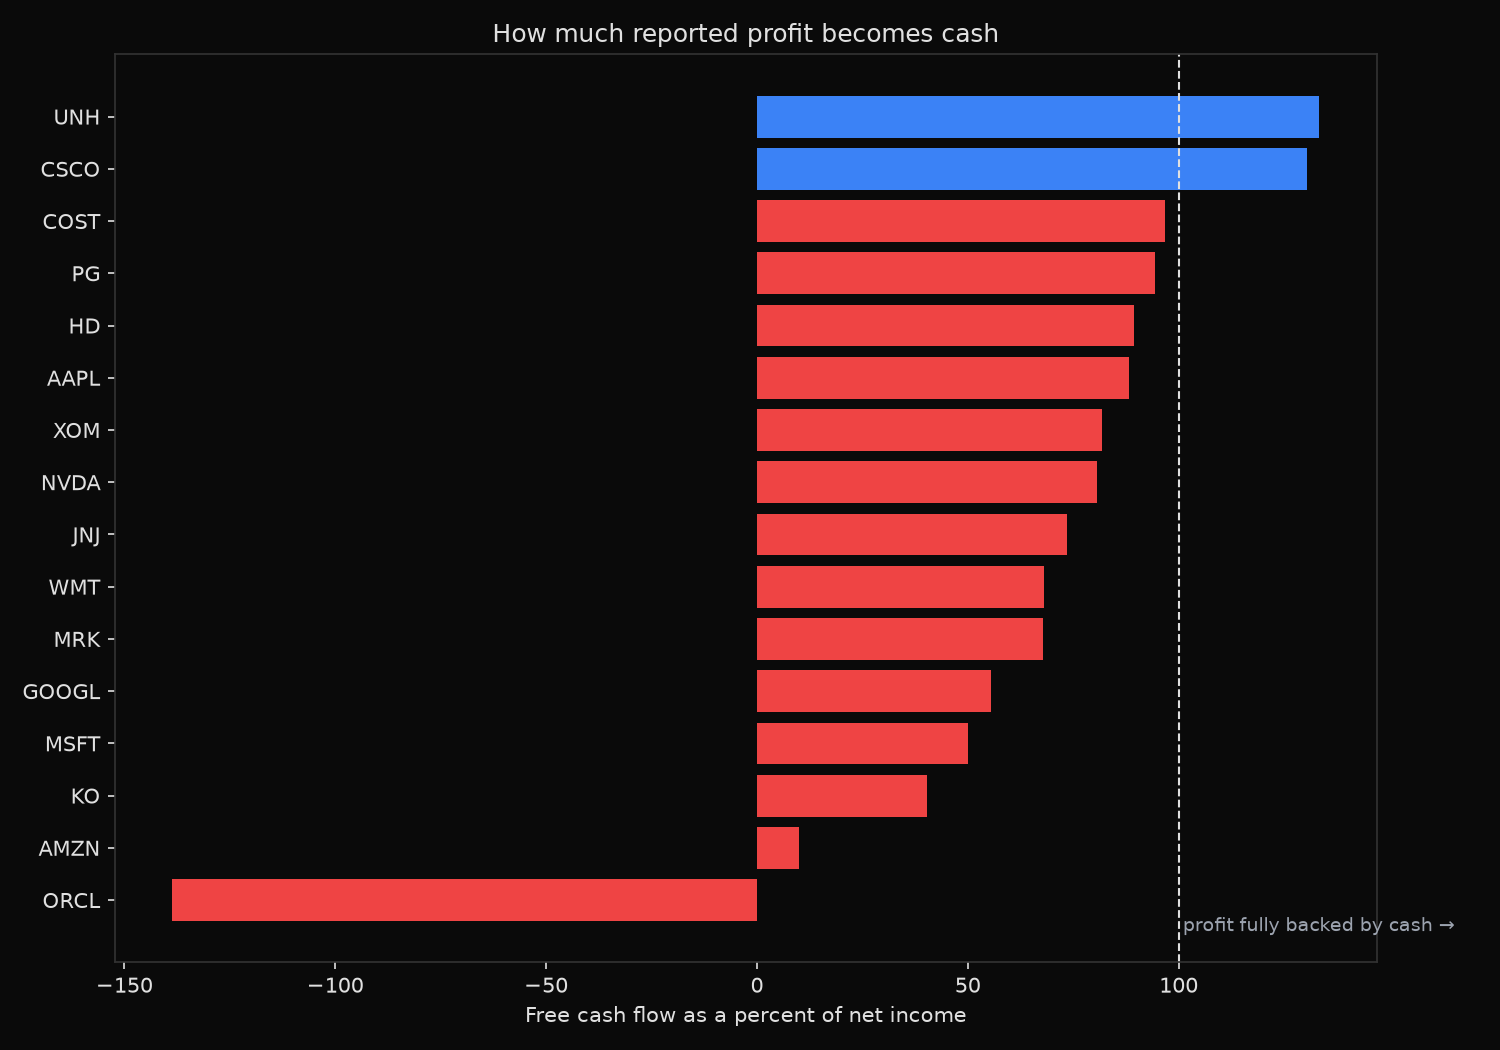
Free cash flow conversion, latest completed fiscal year
ticker     fy_end  rev_$bn  ni_$bn  fcf_$bn  fcf_margin_%  cash_conv_%
   UNH 2025-12-31    447.6    12.1     16.1           3.6          133
  CSCO 2025-07-26     56.7    10.2     13.3          23.5          131
  COST 2025-08-31    275.2     8.1      7.8           2.8           97
    PG 2026-06-30     87.0    16.0     15.1          17.4           94
    HD 2026-02-01    164.7    14.2     12.6           7.7           89
  AAPL 2025-09-27    416.2   112.0     98.8          23.7           88
   XOM 2025-12-31    332.2    28.8     23.6           7.1           82
  NVDA 2026-01-25    215.9   120.1     96.7          44.8           81
   JNJ 2025-12-28     94.2    26.8     19.7          20.9           73
   WMT 2026-01-31    706.4    21.9     14.9           2.1           68
   MRK 2025-12-31     65.0    18.3     12.4          19.0           68
 GOOGL 2025-12-31    402.8   132.2     73.3          18.2           55
  MSFT 2026-06-30    331.8   133.7     67.0          20.2           50
    KO 2025-12-31     47.9    13.1      5.3          11.0           40
  AMZN 2025-12-31    716.9    77.7      7.7           1.1           10
  ORCL 2026-05-31     67.4    17.1    -23.7         -35.2         -139

median cash conversion: 77%
median FCF margin:       14.2%
What this tells us
The typical company in the group converts about three-quarters of its reported profit into cash: the median conversion is 77 percent. Above that line sit mature, capital-light businesses. Cisco and Procter and Gamble turn nearly all of their accounting profit into cash, and UnitedHealth converts more than 100 percent because working capital released cash on top of a thin reported profit.
The interesting story is at the bottom, and it has one cause. Microsoft converts 50 percent, Alphabet 55 percent, Amazon 10 percent, and Oracle sits at negative 139 percent. These are the companies building artificial-intelligence capacity, and the capital expenditure is large enough to swallow the cash their profits would otherwise produce. Oracle is the clearest case: capital spending of roughly 56 billion dollars exceeded its 32 billion dollars of operating cash flow, so free cash flow was negative even though net income was a positive 17 billion.
Nvidia is the counterexample that proves the mechanism. It carries the highest free-cash-flow margin in the group at 44.8 percent, because it designs the chips that its customers install and its own capital spending is small: about 6 billion dollars against 216 billion of revenue. The same artificial-intelligence build-out that drains cash from the operators of data centres pours cash into the company that supplies them.
So what?
A price-to-earnings ratio treats a dollar of Amazon’s profit and a dollar of Apple’s profit as the same thing. Cash conversion says they are not. One dollar is available now; the other has already been committed to concrete and silicon.
Use the ratio as a check on any quality screen. A company that shows high margins and high return on equity, yet converts far below 100 percent for several years running, is funding its growth from something other than its own operations, and that gap tends to surface later as debt or share issuance. Read a single year with caution, since one large tax payment or a working-capital swing can distort it, which is why the calculation pulls several years and treats a persistent gap as the signal rather than a one-off dip.
For the artificial-intelligence names the low conversion is a deliberate wager: today’s cash is being spent on capacity meant to earn its return later. The number does not say whether the bet pays off. It says the profit is not free yet, and an investor should size the position knowing that.
Built with xfinlink — free financial data API for Python.