
What’s the question?
Leading digits in a large collection of naturally occurring numbers do not arrive in equal proportions. Roughly 30 percent begin with 1 and fewer than 5 percent begin with 9, the frequencies falling logarithmically in between: the probability that the first digit equals d is log10(1 + 1/d). Simon Newcomb noticed it in 1881 from uneven wear on the early pages of logarithm tables; Frank Benford rediscovered it in 1938.
Forensic accountants turned it into a screen. A figure produced by measurement tends to inherit the digit distribution; a figure someone constructed usually does not, because people inventing numbers spread the leading digits more evenly than a logarithm does. Mark Nigrini set audit thresholds on the mean absolute deviation statistic, the average gap between observed and expected digit frequencies: below 0.006 counts as close conformity for first digits, above 0.015 as nonconformity.
The screen only means something if honest reported financials pass it. Do the figures S&P 500 companies file follow Benford’s distribution, and does the fit hold evenly across the statement? A weak fit is not evidence of manipulation. It describes how a number is generated.
The approach
The universe is the 500 members of the S&P 500 as the roster stood on 31 December 2015, carried by company identifier rather than by ticker so that names later removed from the index stay in. Annual filings, period ends 2010 to 2025.
- Pull six statement lines per company-year: revenue, total assets, net income, operating cash flow, capital expenditures and diluted earnings per share. The first five are monetary; diluted EPS is a ratio, included as a deliberate contrast.
- Keep company-years reporting all six figures, so that every line is measured on identical rows.
- Require diluted EPS to fall within 25 percent of net income divided by the diluted share count. Company-years where the two are not stated on the same basis drop out.
- Take the leading significant digit of the absolute value of each figure. Blanks and zeros carry no leading digit and are excluded before counting.
- Compare observed counts against Benford’s frequencies with chi-square on 8 degrees of freedom, and with MAD.
That leaves 6,495 company-years across 471 companies, or 38,970 leading digits.
Code
import numpy as np
import pandas as pd
from scipy import stats
import xfinlink as xfl

xfl.set_api_key("YOUR_API_KEY")  # free at https://xfinlink.com/signup

LINES = ["revenue", "total_assets", "net_income",
         "operating_cash_flow", "capital_expenditures", "eps_diluted"]
FIELDS = LINES + ["weighted_avg_shares_diluted"]

DIGITS = np.arange(1, 10)
BENFORD = np.log10(1 + 1 / DIGITS)          # sums to exactly 1

first_digit = lambda x: int(f"{abs(x):.15e}"[0])

ids = xfl.index("sp500", as_of="2015-12-31")["entity_id"].astype(int).tolist()
raw = pd.concat([xfl.fundamentals(entity_id=ids[i:i + 50], period_type="annual",
                                  start="2010-01-01", end="2025-12-31", fields=FIELDS)
                 for i in range(0, len(ids), 50)], ignore_index=True)
raw = raw.drop_duplicates(["entity_id", "period_end"])

d = raw.dropna(subset=FIELDS)
d = d[(d[LINES] != 0).all(axis=1) & (d["weighted_avg_shares_diluted"] > 0)]
ratio = d["eps_diluted"] / (d["net_income"] / d["weighted_avg_shares_diluted"])
sample = d[(ratio >= 0.80) & (ratio <= 1.25)]

for col in LINES:
    v = sample[col].abs()
    obs = np.array([(v.map(first_digit) == k).sum() for k in DIGITS], dtype=float)
    n = obs.sum()
    chi2, p = stats.chisquare(obs, BENFORD * n)
    mad = np.abs(obs / n - BENFORD).mean()
    span = np.log10(v).quantile(0.95) - np.log10(v).quantile(0.05)
    print(f"{col:22} N={int(n):5}  MAD={mad:.4f}  chi2={chi2:7.1f}  p={p:.2e}  span={span:.2f}")

# How large does MAD get on chance alone, at one company's worth of digits?
rng = np.random.default_rng(0)
draws = rng.multinomial(80, BENFORD, size=5000) / 80
print(np.quantile(np.abs(draws - BENFORD).mean(axis=1), [0.5, 0.95]))
Full script with formatting and visualisation: benfords-law-reported-financials-python.py
Output
Roster as of 2015-12-31: 500 companies
Annual filings 2010-2025: 7,213 company-years retrieved
Complete on all six lines:  6,695
After per-share reconciliation: 6,495 company-years, 471 companies
Digits tested: 38,970

Statement line              N      MAD  chi-square    p-value  log10 span
-------------------------------------------------------------------------
Capital expenditures    6,495   0.0039        11.2   1.89e-01        2.10
Total assets            6,495   0.0051        17.6   2.45e-02        1.81
Revenue                 6,495   0.0072        33.4   5.31e-05        1.71
Net income              6,495   0.0079        42.5   1.08e-06        1.81
Operating cash flow     6,495   0.0082        44.7   4.22e-07        1.67
Diluted EPS             6,495   0.0147       148.5   4.11e-28        1.38

Spearman rank correlation, MAD vs magnitude span: rho = -0.94 (p = 0.005, n = 6)

Five monetary lines pooled (N = 32,475):  MAD = 0.0035   chi-square = 53.0   p = 1.09e-08
Digit    Observed   Benford     Diff
1         30.43%    30.10%   +0.33%
2         16.86%    17.61%   -0.75%
3         11.72%    12.49%   -0.77%
4          9.70%     9.69%   +0.01%
5          8.26%     7.92%   +0.35%
6          7.31%     6.69%   +0.61%
7          5.76%     5.80%   -0.04%
8          5.29%     5.12%   +0.18%
9          4.67%     4.58%   +0.10%

Median monetary figures available per company: 80
MAD of clean Benford data at N = 80: median 0.0257, 95th percentile 0.0387
Nigrini first-digit thresholds: 0.0060 close, 0.0120 acceptable, 0.0150 nonconformity
What this tells us
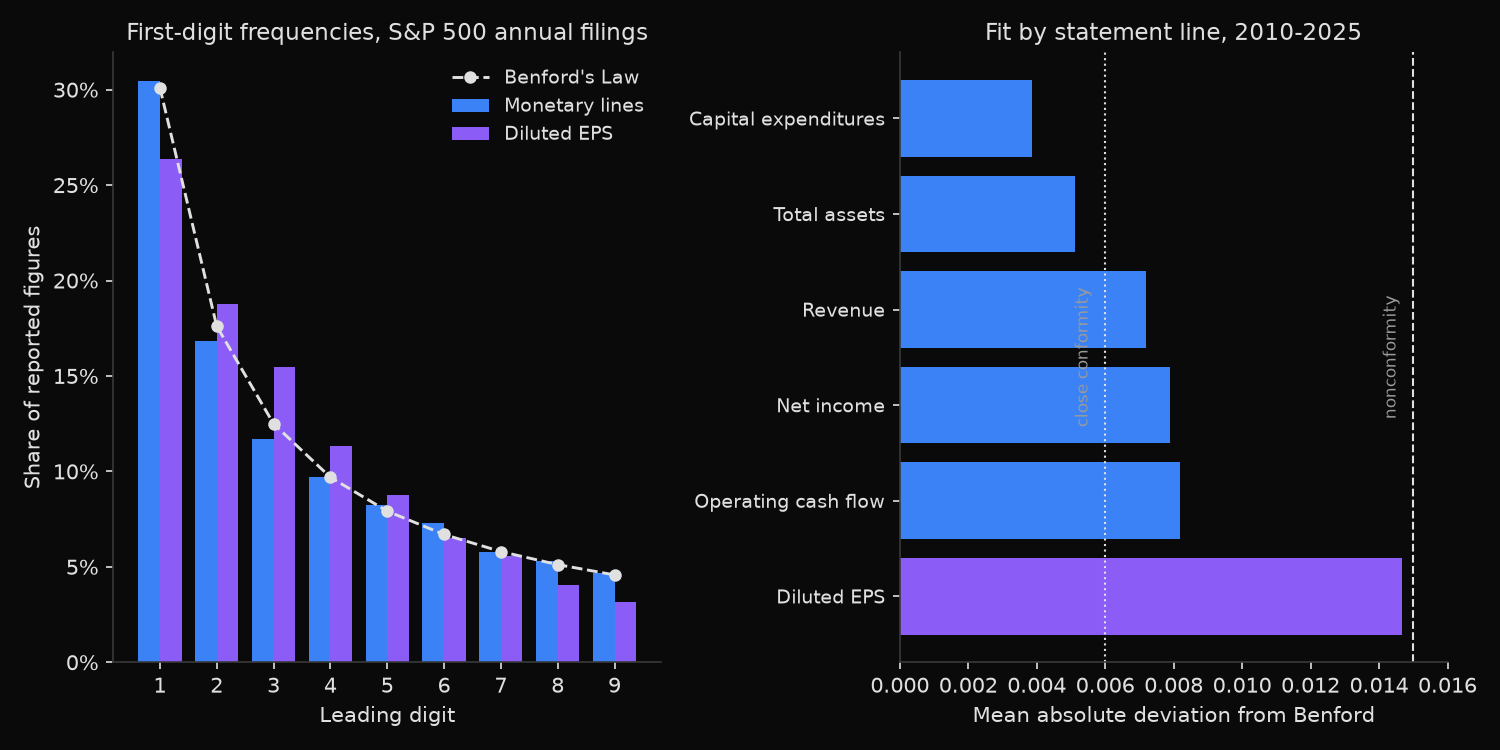
Pooled across the five monetary lines, reported financials track Benford closely. Leading ones account for 30.43 percent of figures against an expected 30.10 percent, nines for 4.67 percent against 4.58 percent, and no digit misses by more than 0.77 percentage points. MAD comes to 0.0035, well inside the close-conformity band. Chi-square gives 53.0 with a p-value of 1.09e-08, rejecting Benford outright. Both results are correct: the statistic scales with sample size, so at 32,475 observations a gap of a third of a percentage point is enough to reject, which is why the forensic literature reports MAD instead.
Fit varies systematically by line, and the last column explains the ordering: log10 span measures how many powers of ten the middle 90 percent of a line covers. Capital expenditures runs from roughly $44m to $5.6bn, 2.10 decades wide, and fits best at MAD 0.0039 with a p-value of 0.19, the only line chi-square does not reject. Diluted EPS covers 1.38 decades and fits worst at 0.0147. Rank correlation between the columns is −0.94.
EPS behaves differently for reasons unconnected to the honesty of any filer. Just under 80 percent of the diluted EPS figures here fall between $1.00 and $10.00, median $3.46, because share counts get set so that earnings per share land where investors find them readable. A quantity squeezed into one order of magnitude cannot produce a logarithmic first-digit distribution; its digits reflect where inside that decade the values cluster, here 26.4 percent ones and 15.5 percent threes.
The last two output lines settle the question of scale. A typical company contributes 80 usable monetary figures, and drawing 80 digits from the exact Benford distribution 5,000 times gives a median MAD of 0.0257 and a 95th percentile of 0.0387, both far above the 0.015 nonconformity threshold.
So what?
Benford’s Law works as a screen on reported financials, but only at population scale and only on lines spanning enough orders of magnitude. Applied to several hundred companies it will surface a real anomaly; applied to one company’s sixteen annual reports it returns noise dressed as a finding.
Set the sample size before the threshold, since the noise floor for MAD depends on N and the published cutoffs assume thousands of observations rather than dozens. Then check the magnitude span of the line being tested: a line confined to a narrow band will fail regardless of who produced the numbers, which covers per-share figures, ratios and margins.
A better use of the same data is the reconciliation in step 3, which flagged 200 company-years where diluted EPS and net income divided by share count disagreed by more than 25 percent. That test assumes nothing about digit distributions and points at something specific whenever it fires. Digit tests narrow a population; identity tests find the row.
Built with xfinlink — free financial data API for Python.