
Do Value Screens Agree on Which Stocks Are Cheap? Multiple Overlap Analysis in Python
August 9, 2026
What’s the question?
Every value screen begins with a choice of yardstick, usually made before any data is examined. Price to earnings divides market price by profit, price to book by the accounting value of shareholders’ equity, price to sales by revenue, price to free cash flow by the cash left after capital spending. EV/EBIT sets enterprise value, which is market capitalisation plus debt minus cash, against operating profit, so it prices the whole business rather than the equity slice.
Five ratios, five denominators. Do they identify the same companies as cheap? If the rankings mostly agree, the choice of multiple is a matter of taste; if they diverge, the holdings of a value portfolio are decided by that opening choice rather than by the market.
Two terms recur below. The cheapest quintile is the 20% of companies with the lowest reading on a multiple. Spearman rank correlation, on a scale from -1 to 1, measures whether two rankings order the same names in the same sequence; it uses positions rather than values, so a company trading at 300 times book does not drag the statistic around.
The approach
The sample is the current S&P 500, measured on a single day: 31 July 2026.
- Pull the index roster, then daily valuation and profitability metrics for the week ending 31 July, keeping the last observation per company so every ratio is priced off the same session.
- Keep the companies where all five multiples are defined and positive. A ratio with a negative denominator cannot be ranked against a positive one, which is the constraint a value screen faces in practice. 236 of the 504 names carry a complete, positive set.
- Rank the survivors from cheapest to most expensive on each multiple and take the cheapest quintile, 47 names per screen.
- Compute Spearman rank correlation for every pair, then the share of each cheapest quintile that also appears in another screen’s.
- Describe each cheap bucket by the median return on equity, net margin, debt to equity and asset turnover of its members.
Code
import pandas as pd
import xfinlink as xfl

xfl.set_api_key("YOUR_API_KEY")  # free at https://xfinlink.com/signup

MULTIPLES = ["pe_ratio", "pb_ratio", "ps_ratio", "price_to_fcf", "ev_ebit"]
EXTRA = ["roe", "net_margin", "debt_to_equity", "asset_turnover", "market_cap"]

tickers = sorted(set(xfl.index("sp500")["ticker"].dropna()))
frames = [
    xfl.metrics(tickers[i:i + 100], period_type="daily",
                start="2026-07-27", end="2026-07-31", fields=MULTIPLES + EXTRA)
    for i in range(0, len(tickers), 100)
]
snap = (pd.concat(frames, ignore_index=True)
          .sort_values("period_end").groupby("ticker", as_index=False).last())

d = snap.dropna(subset=MULTIPLES + EXTRA)
d = d[(d[MULTIPLES] > 0).all(axis=1)]
n_cheap = int(round(len(d) * 0.2))

print(d[MULTIPLES].corr(method="spearman").round(2))

cheap = {c: set(d.nsmallest(n_cheap, c)["ticker"]) for c in MULTIPLES}
for a in MULTIPLES:
    print(a, [round(100 * len(cheap[a] & cheap[b]) / n_cheap) for b in MULTIPLES])

for c in MULTIPLES:
    bucket = d.nsmallest(n_cheap, c)
    print(c, round(100 * bucket["roe"].median(), 1), round(100 * bucket["net_margin"].median(), 1))

print(len(set.intersection(*cheap.values())), len(set.union(*cheap.values())))
Full script with formatting and visualisation: do-value-screens-agree-multiple-overlap-python.py
Output
Snapshot 2026-07-31 | 504 tickers | 236 priced on all five multiples
Cheapest quintile = 47 names per screen

Spearman rank correlation between multiples
          P/E   P/B   P/S  P/FCF  EV/EBIT
P/E      1.00  0.44  0.49   0.68     0.89
P/B      0.44  1.00  0.52   0.52     0.46
P/S      0.49  0.52  1.00   0.58     0.63
P/FCF    0.68  0.52  0.58   1.00     0.71
EV/EBIT  0.89  0.46  0.63   0.71     1.00

Share of one screen's cheapest quintile that also appears in another (%)
         P/E  P/B  P/S  P/FCF  EV/EBIT
P/E      100   49   47     62       77
P/B       49  100   40     47       45
P/S       47   40  100     47       51
P/FCF     62   47   47    100       68
EV/EBIT   77   45   51     68      100

Median profile of each cheapest quintile
   screen  roe  net_margin  debt_to_equity  asset_turnover
      P/E 20.4        15.2            0.50            0.49
      P/B  8.8         9.2            0.53            0.40
      P/S 17.4         5.8            0.79            0.97
    P/FCF 20.0        11.5            0.53            0.52
  EV/EBIT 19.7        12.8            0.50            0.51
all names 19.2        13.6            0.61            0.55

Cheapest quintile on all five multiples: 9 names
  CHTR, CMCSA, CPB, CTSH, DHI, EPAM, FI, HIG, UHS
Cheapest quintile on at least one multiple: 100 names (2.1x the 47 slots a single screen fills)
What this tells us
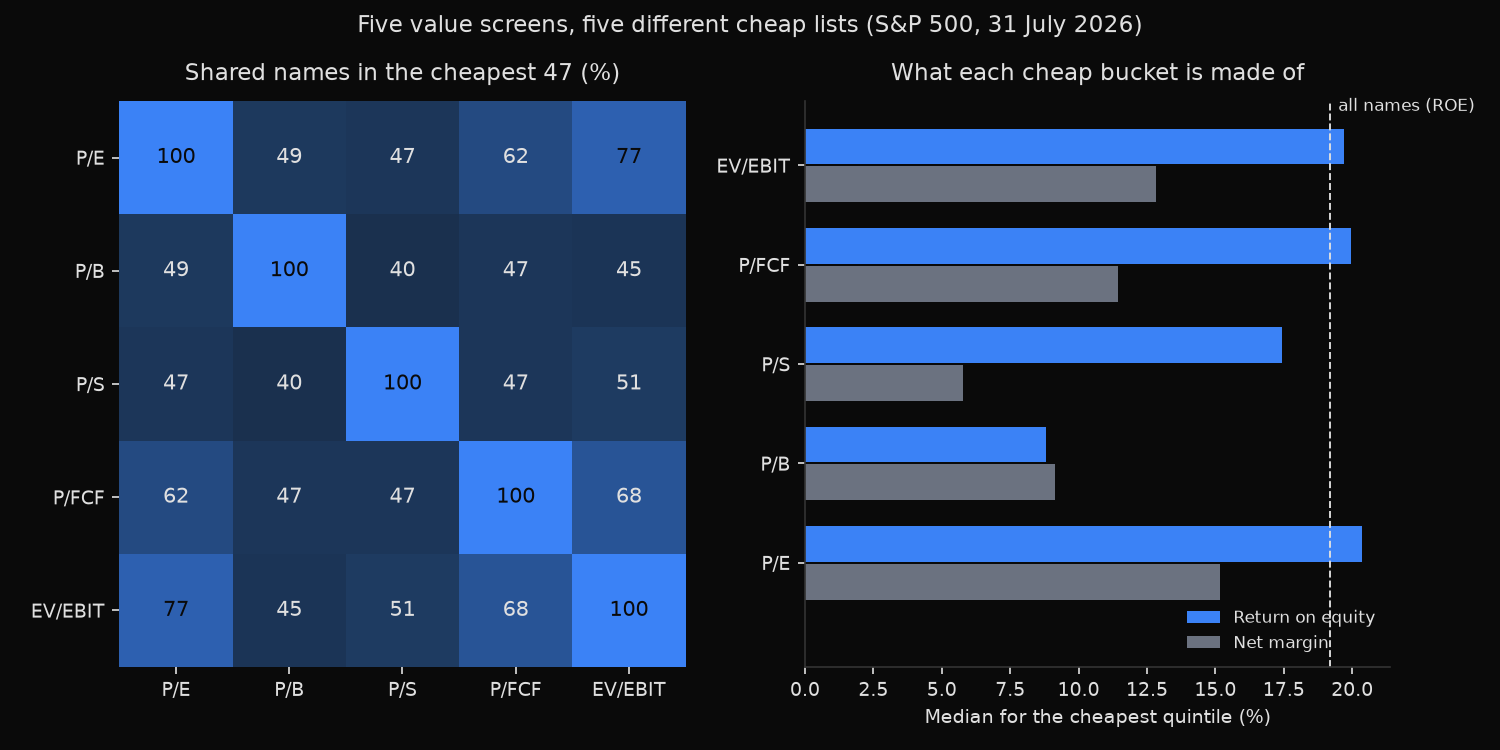
One pair agrees closely and the rest do not. P/E and EV/EBIT rank at 0.89 and share 77% of their cheapest quintile, which follows from their construction: both divide a price by a profit figure, and moving from equity to enterprise value adds debt and subtracts cash without reordering much. Every other pair sits between 0.44 and 0.71.
Price to book is the loner, correlating 0.44 to 0.52 against the other four and sharing only 19 of its 47 cheapest names with the price-to-sales quintile. The bucket profile explains the split: the cheap P/B quintile carries a median return on equity of 8.8%, against 19.2% for the sample and 20.4% for the cheap P/E quintile. Book value records what has been invested in a business, earnings what that investment produces, so sorting on price to book promotes the companies that earn least on their equity. That is a statement about profitability rather than about price.
Price to sales selects on a different axis again, with a median net margin of 5.8% in its cheap quintile against 13.6% for the sample and asset turnover of 0.97 against 0.55: high-volume, thin-margin businesses look cheap on revenue because revenue converts into little profit. Leverage barely separates the buckets, with median debt to equity between 0.50 and 0.79.
Nine companies out of 236 sit in the cheapest quintile on all five measures, while 100 distinct companies appear in at least one, filling 47 slots more than twice over. Averaged across the ten pairs, two screens share 53% of their cheapest quintile.
So what?
Treat the multiple as a parameter of the strategy, not a neutral reading of the same fact. A backtest of a value screen is a backtest of one denominator, and at a rank correlation of 0.44, the record of price to book says little about price to earnings.
Two rules follow. First, never run price to book on its own: a low reading is mostly a low return on equity in disguise, so pair it with a profitability floor or accept that the screen is buying weak compounders. Second, use the intersection when conviction matters more than breadth. The nine names that clear every yardstick are cheap on profit, book, revenue, cash and enterprise value at once, a far stronger claim than cheapness on any single one, at the cost of a list one fifth the size.
For screens that must stay wide, average the ranks of two weakly correlated measures instead of filtering twice: averaging P/E and P/B keeps names moderately cheap on both, where a double filter keeps only the 49% clearing both cuts.
Built with xfinlink — free financial data API for Python. pip install -U xfinlink
pip install -U xfinlink