
How Much of EPS Growth Comes From Share Buybacks? EPS Growth Decomposition in Python
September 16, 2026
What’s the question?
Earnings per share is net income divided by a share count. Growth in it is therefore two events at once: the company earned more, and it divided that profit among fewer shares. Written in logarithms, the relationship is exact rather than approximate.
log EPS growth = log net income growth - log share count growthThat follows from the definition, not from any modelling choice. Valuation attaches to the left-hand side. A company compounding EPS at 10% a year looks the same whether profit doubled or the share count halved, and the two are not equally durable: retiring shares costs cash drawn from the same profit the buyback flatters, while profit growth carries no such ceiling.
So the question is proportion. Across a decade of large-cap results, how much of reported EPS growth came from earning more, and how much from dividing by a smaller number?
The approach
- Take the S&P 500 roster as it stood on 30 June 2014, carrying each member by permanent entity id rather than ticker. The 2014 roster keeps companies that later dropped out; the survivors are the ones that grew.
- Pair each company’s annual report ending between June 2014 and May 2015 with the one ending exactly ten fiscal years later, matching companies against themselves rather than a calendar date.
- Read
net_income,eps_dilutedandweighted_avg_shares_dilutedfrom those rows. The diluted weighted average is the count reported EPS actually divides by. - Require positive net income at both ends, since logarithmic growth is undefined across a sign change.
- Require reported EPS times reported shares to reproduce reported net income within 1%. Otherwise the per-share figure rests on a different earnings base, after preferred dividends or minority interests, and the identity will not close.
- Require one share-count basis throughout. Large-cap counts move by single-digit percentages a year, so a jump beyond 25% marks a split or a share-funded acquisition. That removes genuine dilution along with splits, leaving counts moved by ordinary repurchase and issuance.
- Split each ten-year EPS growth into a profit leg and a share count leg, then check the residual.
Code
import numpy as np
import pandas as pd
import xfinlink as xfl

xfl.set_api_key("YOUR_API_KEY")  # free at https://xfinlink.com/signup

roster = xfl.index("sp500", as_of="2014-06-30")
ids = sorted(roster["entity_id"].unique().tolist())

frames = []
for i in range(0, len(ids), 50):
    frames.append(xfl.fundamentals(
        entity_id=ids[i:i + 50], period_type="annual",
        start="2013-06-01", end="2025-12-31",
        fields=["net_income", "eps_diluted",
                "weighted_avg_shares_diluted", "gics_sector"]))
df = pd.concat([f for f in frames if len(f)], ignore_index=True)

records = []
for eid, g in df.sort_values("period_end").groupby("entity_id"):
    b = g[g.period_end.between("2014-06-01", "2015-05-31")]
    e = g[g.period_end.between("2024-06-01", "2025-05-31")]
    if b.empty or e.empty:
        continue
    b, e = b.iloc[-1], e.iloc[-1]

    vals = [(r.net_income, r.eps_diluted, r.weighted_avg_shares_diluted)
            for r in (b, e)]
    if any(pd.isna(v) or v <= 0 for row in vals for v in row):
        continue
    # EPS x shares must reproduce net income, or the legs describe
    # different earnings bases and the identity will not close.
    if max(abs(eps * sh - ni) / ni for ni, eps, sh in vals) > 0.01:
        continue

    # One share-count basis throughout: a jump beyond 25% in any single
    # year is a split or a share-funded deal, not issuance or buyback.
    sh = g[g.period_end.between(b.period_end, e.period_end)
           ]["weighted_avg_shares_diluted"].astype(float)
    step = (sh / sh.shift(1)).dropna()
    if sh.isna().any() or ((step > 1.25) | (step < 0.80)).any():
        continue

    records.append(dict(
        ticker=e.ticker, sector=e.gics_sector,
        g_eps=np.log(e.eps_diluted / b.eps_diluted),
        g_profit=np.log(e.net_income / b.net_income),
        g_shares=-np.log(e.weighted_avg_shares_diluted
                         / b.weighted_avg_shares_diluted)))

r = pd.DataFrame(records)
r["residual"] = r.g_eps - (r.g_profit + r.g_shares)
ann = lambda x: (np.exp(x / 10) - 1) * 100

print(f"largest residual: {r.residual.abs().max():.5f} log points")
print(f"profit leg {r.g_profit.mean():+.4f} + share count leg "
      f"{r.g_shares.mean():+.4f} = EPS growth {r.g_eps.mean():+.4f}")
print(f"share count share of EPS growth: "
      f"{100 * r.g_shares.mean() / r.g_eps.mean():.1f}%")
Full script with formatting and visualisation: eps-growth-decomposition-share-count.py
Output
SAMPLE CONSTRUCTION
   484  companies in the 2014 roster
   394  both endpoint fiscal years reported
   389  endpoints exactly ten fiscal years apart
   378  earnings, per-share and share count all present
   335  profitable in both endpoint years
   221  endpoint rows reconcile within 1%
   221  continuous annual share-count history
   171  share count on a single basis throughout

IDENTITY CHECK  largest residual across 171 companies: 0.01136 log points

DECOMPOSITION OF TEN-YEAR EPS GROWTH (cross-sectional mean, log points)
  profit leg        +0.4755
  share count leg   +0.1668
  sum of the legs   +0.6423
  EPS growth        +0.6423
  share of EPS growth supplied by the share count: 26.0%

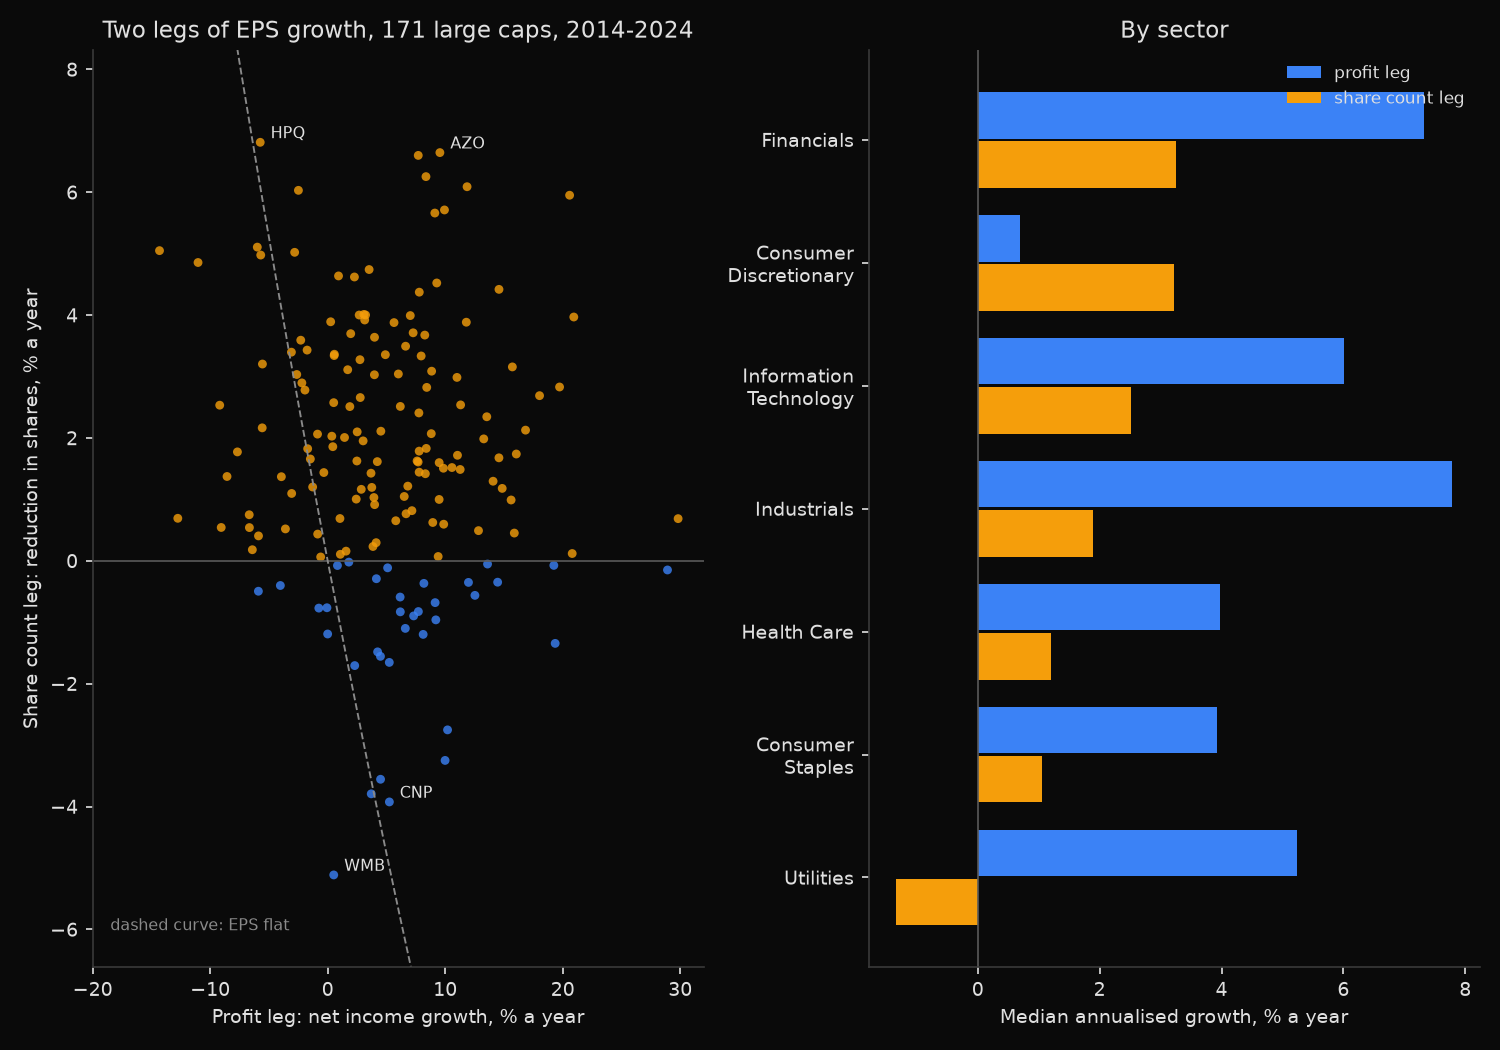
FOR SCALE, MEDIAN COMPANY, ANNUALISED: EPS 6.49%   profit 4.52%   share count 1.62%

  share count retired: 136 of 171 companies
  EPS rose while profit fell: 13 companies
  median share of EPS growth from the share count, among the 123 companies growing EPS at 2% a year or better: 18.5%

LARGEST SHARE COUNT LEG (annualised %)
      company                           EPS   profit   shares
HPQ   H P INC                           0.7     -5.7      6.8
AZO   AUTOZONE INC                     16.8      9.5      6.6
AMP   AMERIPRISE FINANCIAL INC         14.8      7.7      6.6
MCK   MCKESSON CORP                    15.2      8.4      6.3
ORLY  O REILLY AUTOMOTIVE INC          18.7     11.9      6.1
TNL   TRAVEL & LEISURE CO               3.4     -2.5      6.0
PHM   PULTE GROUP INC                  27.8     20.6      6.0
LOW   LOWES COMPANIES INC              16.3      9.9      5.7
L     LOEWS CORP                       15.3      9.1      5.7
HOG   HARLEY DAVIDSON INC              -1.2     -6.0      5.1
STX   SEAGATE TECHNOLOGY HOLDINGS     -10.0    -14.3      5.1
BBY   BEST BUY COMPANY INC              2.1     -2.8      5.0

BY SECTOR, MEDIAN ANNUALISED % (sectors with at least 10 companies)
sector                       n     EPS   profit   shares
Financials                  16    10.8      7.3      3.3
Consumer Discretionary      26     3.4      0.7      3.2
Information Technology      23     8.4      6.0      2.5
Industrials                 34     9.4      7.8      1.9
Health Care                 25     5.2      4.0      1.2
Consumer Staples            15     4.4      3.9      1.0
Utilities                   12     3.2      5.2     -1.3
What this tells us
The identity closes. Across all 171 companies the largest gap between reported EPS growth and the sum of its legs is 0.011 log points over ten years, about a tenth of a point a year.
A quarter of large-cap EPS growth was not profit. The mean profit leg of 0.4755 log points and share count leg of 0.1668 sum exactly to 0.6423, putting 26.0% of aggregate EPS growth on the share count. For the median company that is 4.52% a year of profit growth against 1.62% from a shrinking denominator, and 136 of the 171 finished with fewer shares than they started with.
Thirteen grew earnings per share while net income fell, so for those the share count did more than all of the work. HP Inc, Travel + Leisure and Best Buy each retired 5% to 7% of their shares a year against declining profit. HP Inc rewards care: its lower 2024 profit partly reflects the 2015 separation of its enterprise business, and structural changes of that kind land inside the profit leg.
The sector split is wide, and one sector runs backwards. Financials and consumer discretionary names took about 3.2% a year from their share counts, against 1.0% for consumer staples. Utilities are the only sector where the share count subtracts, a median 1.3% a year of dilution that turned 5.2% profit growth into 3.2% of EPS growth; they fund rate-base spending partly with equity, and eleven of twelve issued net shares. Consumer discretionary runs the other way, at a median profit leg of 0.7%, which the 2014 roster explains: Macy’s, Nordstrom and Gap are all still in it and all shrank.
So what?
Treat a reported EPS growth rate as a compound number and take it apart before paying a multiple for it. The subtraction separates a rate that can persist from one running on repurchase capacity.
When screening for growth, rank on net income growth alongside EPS growth and study the names where the two disagree by more than a couple of points a year: that gap is the buyback, and it stops when the cash does. Across sectors, the share count leg has a median well away from zero in both directions, so a utility on 3% EPS growth and a retailer on 3% EPS growth are not describing the same performance.
Keep the step 5 reconciliation for its own sake: where EPS times shares fails to reproduce net income, the two figures sit on different bases and any ratio mixing them inherits the gap.
Built with xfinlink — free financial data API for Python. pip install -U xfinlink
pip install -U xfinlink