
Are AI Earnings Supported by Cash Flow? Accrual and Capex Screen in Python
May 31, 2026
What's the question?
An earnings boom is more durable when accounting profit is supported by operating cash flow. Operating cash flow is cash generated by the business before capital expenditure. Free cash flow is operating cash flow minus capital expenditure. A company can report strong net income while cash flow weakens if working capital, non-cash items, or aggressive investment absorb cash.
This matters for AI because the debate is not only about revenue growth. It is also about the quality of the earnings behind that growth. If AI-linked companies show weak cash conversion, negative free cash flow, or capex consuming most operating cash flow, the earnings base is more vulnerable. If they convert earnings to cash and retain free cash flow after capex, the boom has stronger financial support.
The approach
The screen covers NVDA, ORCL, MSFT, AMZN, META, GOOG, AVGO, and PLTR. It uses the latest annual fundamentals for each company.
- Compute operating cash flow divided by net income
- Compute free cash flow margin, which is free cash flow divided by revenue
- Compute capital expenditure as a share of operating cash flow
- Compute an accrual ratio: net income minus operating cash flow, divided by total assets
- Compute stock-based compensation as a share of revenue
The goal is to distinguish cash-supported earnings from earnings that depend more heavily on reinvestment and non-cash adjustments.
Code
import xfinlink as xfl
import pandas as pd

xfl.set_api_key("YOUR_API_KEY")  # free at https://xfinlink.com/signup

tickers = ["NVDA", "ORCL", "MSFT", "AMZN", "META", "GOOG", "AVGO", "PLTR"]
fields = ["revenue", "net_income", "operating_cash_flow", "free_cash_flow",
          "capital_expenditures", "total_assets", "stock_based_compensation_cf"]

df = xfl.fundamentals(tickers, period_type="annual", period="4y", fields=fields)
latest = df.sort_values("period_end").groupby("ticker").tail(1).copy()

latest["capex_abs"] = latest["capital_expenditures"].abs()
latest["cash_conversion"] = latest["operating_cash_flow"] / latest["net_income"]
latest["fcf_margin"] = latest["free_cash_flow"] / latest["revenue"]
latest["capex_to_ocf"] = latest["capex_abs"] / latest["operating_cash_flow"]
latest["accrual_ratio"] = (
    latest["net_income"] - latest["operating_cash_flow"]
) / latest["total_assets"]

print(latest[["ticker", "cash_conversion", "fcf_margin", "capex_to_ocf"]])
Full script with formatting and visualisation: ai-earnings-cash-flow-quality-python.py
Output
=== AI Earnings Cash-Flow Quality Screen ===
Latest annual period per company (max period_end 2026-01-25)

ORCL  OCF/net_income=1.67x  FCF_margin= -0.7%  capex/OCF=101.9%  accrual_ratio= -5.0%  SBC/revenue= 8.1%
AMZN  OCF/net_income=1.80x  FCF_margin=  1.1%  capex/OCF=94.5%  accrual_ratio= -7.6%  SBC/revenue= 2.7%
META  OCF/net_income=1.92x  FCF_margin= 22.9%  capex/OCF=60.2%  accrual_ratio=-15.1%  SBC/revenue=10.2%
GOOG  OCF/net_income=1.25x  FCF_margin= 18.2%  capex/OCF=55.5%  accrual_ratio= -5.5%  SBC/revenue= 6.7%
MSFT  OCF/net_income=1.34x  FCF_margin= 25.4%  capex/OCF=47.4%  accrual_ratio= -5.5%  SBC/revenue= 4.3%
NVDA  OCF/net_income=0.86x  FCF_margin= 44.8%  capex/OCF= 5.9%  accrual_ratio= +8.4%  SBC/revenue= 3.0%
AVGO  OCF/net_income=1.19x  FCF_margin= 42.1%  capex/OCF= 2.3%  accrual_ratio= -2.6%  SBC/revenue=11.8%
PLTR  OCF/net_income=1.31x  FCF_margin= 46.9%  capex/OCF= 1.6%  accrual_ratio= -5.7%  SBC/revenue=15.3%

Companies with OCF/net income >= 1.2x: ORCL, AMZN, META, GOOG, MSFT, PLTR
Companies with negative free cash flow margin: ORCL
What this tells us
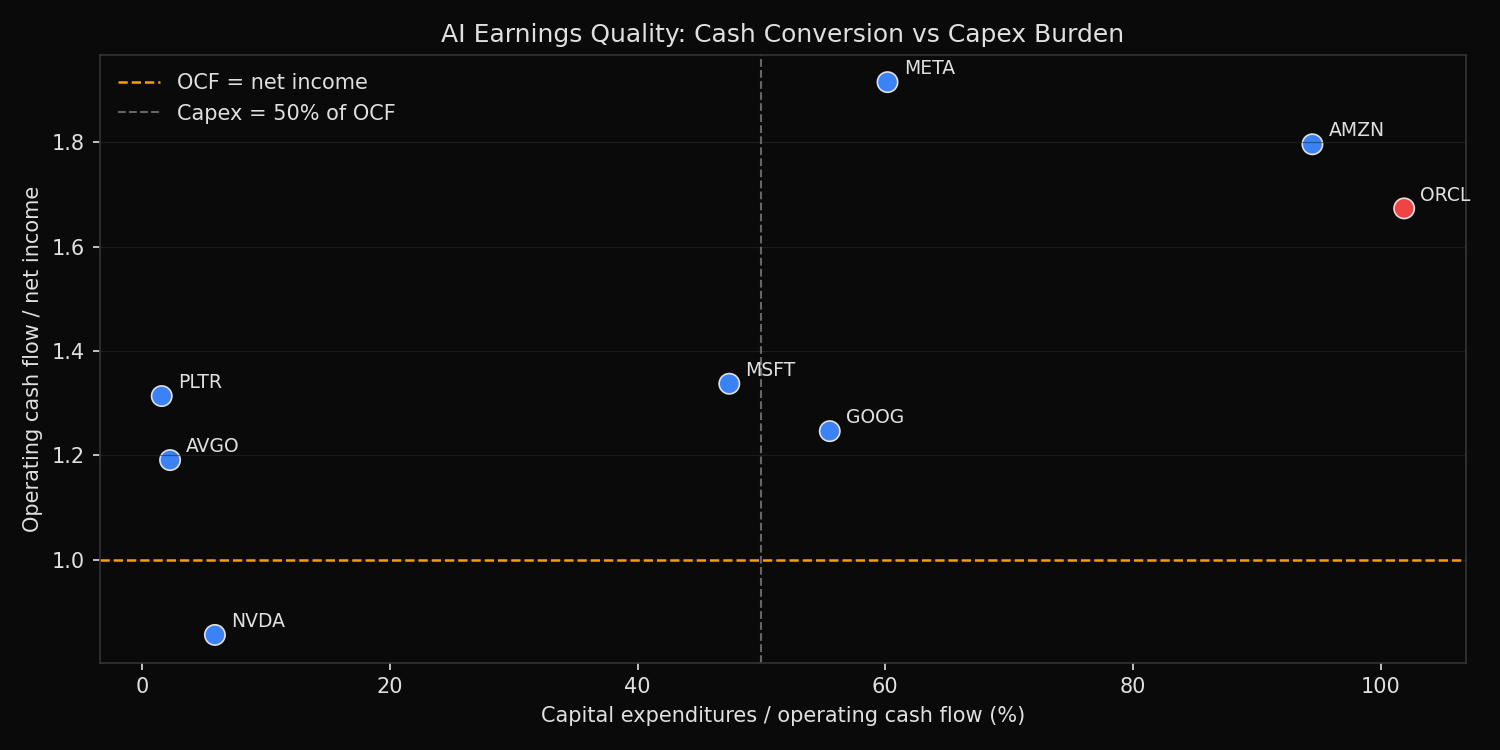
The screen does not show uniformly weak earnings quality. Six of eight companies convert net income into operating cash flow at 1.2 times or better. META has the strongest cash conversion at 1.92x, followed by AMZN at 1.80x and ORCL at 1.67x. These figures indicate that reported earnings are supported by cash receipts and working-capital dynamics, not only by accounting profit.
The capex burden changes the interpretation. ORCL converts earnings to operating cash flow, but capital expenditure consumes 101.9% of operating cash flow, leaving a negative free cash flow margin of -0.7%. AMZN has a similar capex burden at 94.5% of operating cash flow and only a 1.1% free cash flow margin. These are not weak operating businesses. They are businesses where reinvestment absorbs the cash.
NVDA is the opposite case. Its operating cash flow is 0.86 times net income, but free cash flow margin is 44.8% because capex is only 5.9% of operating cash flow. The supplier model remains far less capital intensive than the infrastructure-buyer model.
So what?
The cash-flow evidence argues against a blanket claim that AI earnings are low quality. The more precise risk is capex absorption. ORCL and AMZN are the names where investment spending leaves the least cash after operations. NVDA, AVGO, and PLTR produce high free cash flow margins because their models require less physical infrastructure relative to revenue.
For forecasting, the key variable is not only revenue growth. It is the path from revenue to operating cash flow to free cash flow. A company can have excellent cash conversion and still be financially stretched if capex consumes the cash. AI valuation models should therefore separate operating quality from reinvestment burden before assigning multiples.
Built with xfinlink — free financial data API for Python. pip install xfinlink
pip install xfinlink