

Do Stocks Earn Their Returns Overnight or Intraday? Return Decomposition in Python
July 28, 2026
What’s the question?
A trading day is really two sessions. The first runs from the previous close to the next open, when the exchange is shut and almost nobody can transact: earnings land, foreign markets move, and the price reappears somewhere else. The second runs from that open to that close. Full-day price return is the product of the two, so (1 + overnight) × (1 + intraday) recovers the whole move.
The split matters because the two sessions reach different people. A market maker who flattens inventory before the bell never holds the overnight leg, and neither does a day trader or a fund with an overnight risk limit. If the compounding happens while the market is shut, everyone avoiding that exposure is declining part of what they were paid to hold.
The question here is descriptive: over a decade of US large caps, how much of the price return accrued in each session, and does the answer hold across sectors? Lou, Polk and Skouras, writing in the Journal of Financial Economics in 2019, found the sessions differ enough to flip a signal’s sign.
The approach
Daily open, close, dividend, split factor and reported total daily return for 86 liquid US large caps, 2 January 2015 to 31 December 2024.
- Restate the previous close on today’s share basis by dividing it by the split factor in force. Splits land between a close and the following open, so a four-for-one split left uncorrected reads as a 75% overnight collapse.
- Form the legs: overnight is the open over that restated previous close, intraday is the close over the open.
- Reconcile every session. The two legs compounded, plus the dividend measured against the same restated previous close, must reproduce the reported total return for that date. All 213,774 candidate sessions go through this check.
- Drop any name failing on any session, since a failure means value left the share by a route the two legs cannot represent.
- Keep the three most heavily traded survivors in each of the eleven GICS sectors, by median daily turnover, then compound each leg separately.
Step 3 carries the analysis. Mixing an as-traded open against a split-adjusted close corrupts the decomposition silently, and the error hides inside the one leg nobody inspects by eye. The check also selects the sample: a share distribution is not an overnight price move, and counting one as such would manufacture the result.
Code
import pandas as pd
import xfinlink as xfl

xfl.set_api_key("YOUR_API_KEY")  # free at https://xfinlink.com/signup

FIELDS = ["open", "close", "return_daily", "split_ratio", "dividend", "volume"]
px = pd.concat([xfl.prices(t, start="2015-01-02", end="2024-12-31", fields=FIELDS)
                for t in CANDIDATES]).sort_values(["ticker", "date"]).reset_index(drop=True)

# the previous close, restated on today's share basis
split = px["split_ratio"].astype(float).fillna(1.0)
prev_close = px.groupby("ticker")["close"].shift(1) / split

px["overnight"] = px["open"] / prev_close - 1.0
px["intraday"] = px["close"] / px["open"] - 1.0
px["div_leg"] = px["dividend"].astype(float).fillna(0.0) / prev_close

# the legs must rebuild the reported total return, session by session
px["rebuilt"] = (1 + px["overnight"]) * (1 + px["intraday"]) - 1 + px["div_leg"]
px["resid"] = (px["rebuilt"] - px["return_daily"]).abs()
excluded = sorted(px.loc[px["resid"] > 1e-4, "ticker"].unique())

clean = px[~px["ticker"].isin(excluded)].copy()
clean["turnover"] = clean["close"] * clean["volume"]
rank = (clean.groupby(["gics_sector", "ticker"])["turnover"].median().reset_index()
        .sort_values(["gics_sector", "turnover"], ascending=[True, False]))
universe = rank.groupby("gics_sector").head(3)["ticker"].tolist()

panel = clean[clean["ticker"].isin(universe)].dropna(subset=["overnight"])
ew = panel.pivot_table(index="date", values=["overnight", "intraday"], aggfunc="mean")
print((1 + ew["overnight"]).prod(), (1 + ew["intraday"]).prod())
Full script with formatting and visualisation: overnight-vs-intraday-return-decomposition-python.py
Output
================================================================================
STEP 1  RECONCILIATION   overnight x intraday + dividend  vs  reported total return
  candidate names            : 86
  sessions checked           : 213,774
  share splits inside window : 17
  median absolute residual   : 2.49e-07
  sessions off by over 1 bp  : 11  across 8 names

ticker  date            rebuilt   reported   corporate action
T       2022-04-11      -18.68%     +6.15%   Warner Bros Discovery spin-off
DHR     2016-07-05      -21.42%     +2.33%   Fortive spin-off
CB      2016-01-15      -14.05%     -1.48%   ACE / Chubb merger completion
DHR     2023-10-02      -13.85%     -2.41%   Veralto spin-off
APD     2016-10-03       -6.50%     +2.81%   Versum Materials spin-off
MRK     2021-06-03       -2.58%     +2.29%   Organon spin-off
IBM     2021-11-04       -4.94%     -0.79%   Kyndryl spin-off
HON     2018-10-29       -3.41%     -0.46%   Resideo spin-off
O       2021-11-15       -2.20%     +0.73%   Orion Office REIT spin-off
HON     2018-10-01       +0.02%     +1.13%   Garrett Motion spin-off
HON     2016-10-03       -0.46%     +0.10%   AdvanSix spin-off

  every split in the window reconciles; the 11 exceptions are all share
  distributions. Names dropped: APD, CB, DHR, HON, IBM, MRK, O, T

================================================================================
STEP 2  UNIVERSE   33 names, 11 sectors, 2,515 sessions, 2015-01-02 to 2024-12-31

CUMULATIVE PRICE RETURN, SPLIT BY SESSION
           overnight    intraday     full day   ann. o/n  ann. intra
NVDA        +5109.1%     +412.3%    +26584.5%    +48.51%     +17.75%
TSLA        +1560.0%      +66.4%     +2662.1%    +32.45%      +5.23%
NFLX         +532.6%     +182.6%     +1688.1%    +20.27%     +10.95%
AMZN        +1891.8%      -28.6%     +1322.2%    +34.89%      -3.31%
AAPL          +41.0%     +550.0%      +816.2%     +3.49%     +20.59%
MSFT         +270.6%     +143.2%      +801.4%    +14.00%      +9.30%
GOOG          +75.9%     +313.8%      +627.7%     +5.81%     +15.27%
COST         +100.1%     +223.3%      +547.0%     +7.19%     +12.46%
UNH          +211.2%      +61.3%      +401.9%    +12.03%      +4.90%
CAT           +92.5%     +105.1%      +294.8%     +6.77%      +7.45%
SHW           +43.8%     +170.3%      +288.6%     +3.70%     +10.46%
JPM          +153.4%      +51.4%      +283.6%     +9.75%      +4.23%
HD            +33.5%     +181.7%      +276.1%     +2.93%     +10.92%
WMT           +49.4%     +111.2%      +215.5%     +4.10%      +7.77%
NEE           +31.3%     +104.6%      +168.8%     +2.77%      +7.43%
LMT          +175.2%       -8.7%      +151.4%    +10.66%      -0.90%
BAC          +183.1%      -13.3%      +145.5%    +10.97%      -1.41%
PLD          +136.7%       +2.8%      +143.4%     +9.00%      +0.28%
ECL           +82.1%      +23.4%      +124.6%     +6.18%      +2.12%
UNP           +43.9%      +33.6%       +92.3%     +3.71%      +2.94%
AMT           +29.2%      +42.4%       +84.0%     +2.60%      +3.60%
SO            -41.9%     +186.8%       +66.7%     -5.28%     +11.12%
AMGN          +83.6%      -11.2%       +63.0%     +6.26%      -1.18%
FCX          +229.2%      -50.9%       +61.7%    +12.66%      -6.86%
KO            +60.7%       -8.0%       +47.7%     +4.86%      -0.83%
COP          +161.7%      -45.0%       +43.9%    +10.10%      -5.81%
JNJ           +17.6%      +17.6%       +38.4%     +1.64%      +1.64%
CVX          +110.1%      -38.8%       +28.7%     +7.71%      -4.79%
WFC           +53.7%      -16.5%       +28.4%     +4.39%      -1.78%
DUK            +1.3%      +26.5%       +28.2%     +0.13%      +2.38%
DIS          +144.1%      -51.3%       +18.8%     +9.34%      -6.95%
XOM           +44.2%      -19.6%       +15.9%     +3.73%      -2.16%
SPG          +243.5%      -73.0%        -7.1%    +13.14%     -12.26%
--------------------------------------------------------------------
SPY           +91.7%      +48.9%      +185.3%     +6.72%      +4.06%

  overnight leg larger than intraday leg : 21 of 33 names
  intraday leg negative over ten years   : 12 names
  overnight leg negative over ten years  : 1 names

EQUAL-WEIGHT BASKET OF THE 33 NAMES, ONE DOLLAR INVESTED 2 JANUARY 2015
  overnight session only   $  2.69   +10.42% a year
  intraday session only    $  1.72    +5.57% a year
  both sessions            $  4.63   +16.58% a year
  mean return per session   overnight  +4.23 bp   intraday  +2.50 bp
  volatility per session    overnight   0.75%    intraday   0.82%
  return per unit of risk   overnight   0.89     intraday   0.48
  share of positive sessions  overnight 56.9%     intraday 54.2%

BY SECTOR, MEAN RETURN PER SESSION IN BASIS POINTS
sector                      overnight   intraday  difference
Consumer Discretionary          +9.39      +3.62       +5.77
Information Technology          +8.43      +7.38       +1.05
Communication Services          +5.36      +3.62       +1.74
Financials                      +3.96      +1.09       +2.87
Materials                       +3.83      +2.42       +1.41
Real Estate                     +3.61      -0.03       +3.64
Energy                          +3.55      -0.52       +4.07
Industrials                     +3.21      +2.07       +1.13
Health Care                     +2.88      +1.43       +1.45
Consumer Staples                +2.37      +2.97       -0.60
Utilities                       -0.10      +3.38       -3.49

  sectors where overnight beats intraday: 9 of 11
What this tells us
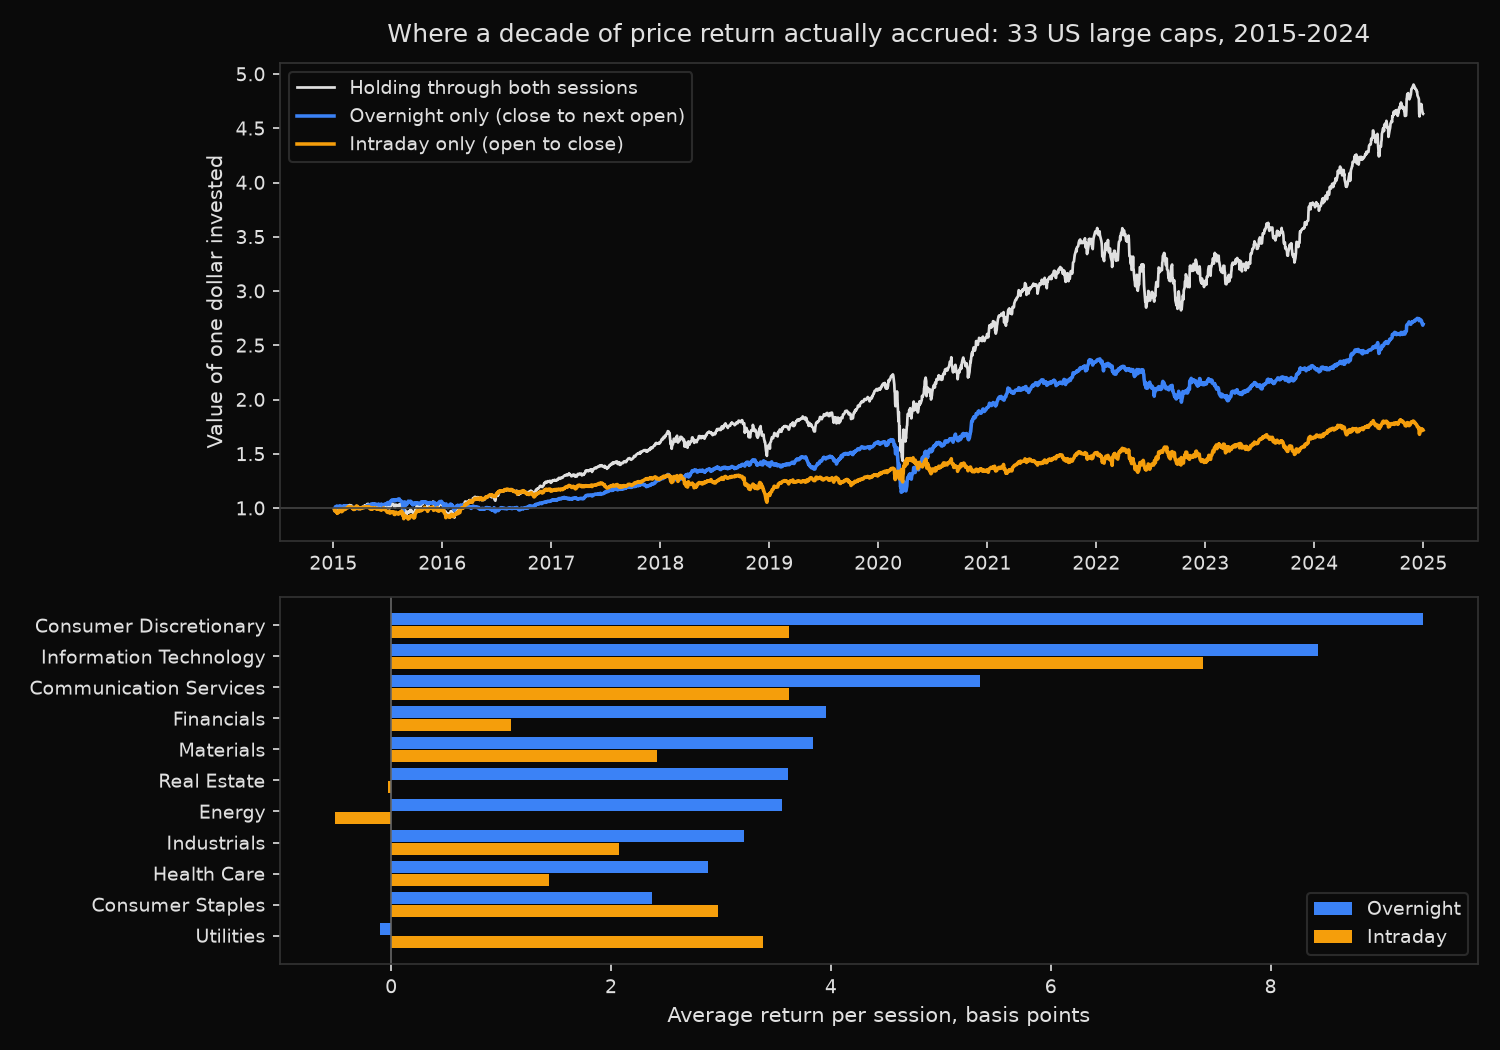
The overnight session did the heavier lifting, at lower risk. One dollar spread equally across the 33 names and held only from close to open grew to $2.69; held only from open to close it grew to $1.72. Because the basket rebalances at every open and every close, the two legs multiply exactly to the $4.63 earned by holding straight through. Per session the overnight leg averaged 4.23 basis points against 2.50 intraday, at lower volatility, which lifts return per unit of risk to 0.89 against 0.48.
This is a tendency rather than a law. Twenty-one of 33 names show a larger overnight leg, so twelve run the other way, two of them among the biggest in the sample: Apple compounded +41.0% overnight against +550.0% intraday, Alphabet +75.9% against +313.8%.
Nine of eleven sectors favour the overnight session. The exceptions are Utilities and Consumer Staples, the defensive corners of the market, while the gap is widest in Consumer Discretionary, Energy and Real Estate, all sensitive to news arriving outside trading hours. That fits the overnight premium being payment for gap risk. Twelve names finished the decade with a negative intraday leg and a positive full-day return, so every cent of their appreciation and more arrived between the closing bell and the opening auction.
So what?
This is not a strategy. Capturing the overnight leg alone means a round trip on every one of the 2,515 sessions, and 4.23 basis points leaves little room once the spread is crossed twice a day. It changes how a position is measured, though. A backtest that computes returns close-to-close while assuming fills at the open is not measuring the strategy it claims to: the two streams have different means, different volatilities, and in twelve of these names different signs. A mandate that flattens into the close is declining the higher-Sharpe half of the return, a cost that belongs on the books rather than free prudence.
Run the reconciliation first. Eleven sessions out of 213,774 failed here, every one a share distribution rather than a price move. Left in, they would have loaded roughly minus 18% onto one name’s overnight leg and biased the conclusion.
Built with xfinlink — free financial data API for Python. pip install xfinlink
pip install xfinlink