
Which Companies Have the Highest Accrual Ratios? Earnings Quality Screening in Python
May 17, 2026
What’s the question?
Reported earnings (net income) and cash flow from operations measure profitability through different lenses. Net income follows accrual accounting rules — it recognizes revenue when earned and expenses when incurred, regardless of when cash changes hands. Operating cash flow measures actual cash generated by the business. The difference between these two numbers is the accrual component of earnings. The accrual ratio — defined as (net income minus operating cash flow) divided by total assets — quantifies how much of a company’s reported earnings are supported by actual cash generation versus accounting adjustments. A positive accrual ratio means earnings exceed cash flow, suggesting that accounting choices (revenue recognition timing, expense deferrals, asset capitalization) are inflating reported profitability. A negative accrual ratio means cash flow exceeds earnings, indicating conservative accounting or genuinely cash-generative operations. Richard Sloan’s 1996 research documented the accrual anomaly: stocks with high accrual ratios (low earnings quality) tend to underperform those with low accrual ratios (high earnings quality) over subsequent periods.
The approach
Pull the most recent annual fundamentals for 8 large-cap stocks. Extract net income, operating cash flow, and total assets. Compute the accrual ratio for each company and rank from highest (lowest earnings quality) to lowest (highest earnings quality). A ratio near zero indicates tight alignment between earnings and cash flow. Large positive values warrant scrutiny — they may reflect aggressive accounting or a business model where revenue recognition leads cash collection.
import xfinlink as xfl
import pandas as pd

xfl.api_key = "YOUR_API_KEY"  # free at https://xfinlink.com/signup

# -- Configuration ----------------------------------------------------------
tickers = ["AAPL", "MSFT", "NVDA", "AMZN", "META", "XOM", "JNJ", "PG", "CRM", "TSLA"]

# -- Fetch latest annual fundamentals --------------------------------------
df = xfl.fundamentals(
    tickers,
    period_type="annual",
    fields=["net_income", "operating_cash_flow", "total_assets"],
    period="3y",
)

# -- Keep most recent annual period per ticker ------------------------------
latest = df.sort_values("period_end").groupby("ticker").tail(1).copy()

# -- Compute accrual ratio -------------------------------------------------
latest["accrual_ratio"] = (
    (latest["net_income"] - latest["operating_cash_flow"]) / latest["total_assets"]
)

# -- Classify quality -------------------------------------------------------
def quality_label(ar):
    if ar > 0.05:
        return "Low"
    elif ar > 0:
        return "Neutral"
    elif ar > -0.10:
        return "High"
    else:
        return "Highest"

latest["quality"] = latest["accrual_ratio"].apply(quality_label)
latest = latest.sort_values("accrual_ratio", ascending=False)

# -- Print results ----------------------------------------------------------
print("=== Accrual Ratio: Earnings Quality Screen (Latest Annual) ===")
header = (
    f"{'Ticker':6s}  {'Period':>12s}  {'Net Income':>12s}  {'OCF':>12s}  "
    f"{'Total Assets':>14s}  {'Accrual Ratio':>14s}   Quality"
)
print(header)
print("-" * 87)

for _, r in latest.iterrows():
    ni_str = f"${r['net_income'] / 1e3:>7.1f}B"
    ocf_str = f"${r['operating_cash_flow'] / 1e3:>7.1f}B"
    ta_str = f"${r['total_assets'] / 1e3:>8.1f}B"
    ar_str = f"{r['accrual_ratio']:>+8.3f}"
    print(
        f"{r['ticker']:6s}  {str(r['period_end'])[:10]:>12s}  {ni_str:>12s}  "
        f"{ocf_str:>12s}  {ta_str:>14s}  {ar_str:>14s}   {r['quality']}"
    )

# -- Summary ----------------------------------------------------------------
print("\n=== Summary ===")
best = latest.iloc[-1]
worst = latest.iloc[0]
spread = worst["accrual_ratio"] - best["accrual_ratio"]
print(
    f"Highest quality (most negative accrual ratio): {best['ticker']}"
    f" at {best['accrual_ratio']:+.3f}"
)
print(
    f"Lowest quality (most positive accrual ratio):  {worst['ticker']}"
    f" at {worst['accrual_ratio']:+.3f}"
)
print(f"Spread: {spread:.3f} -- significant divergence in earnings quality")
Output:
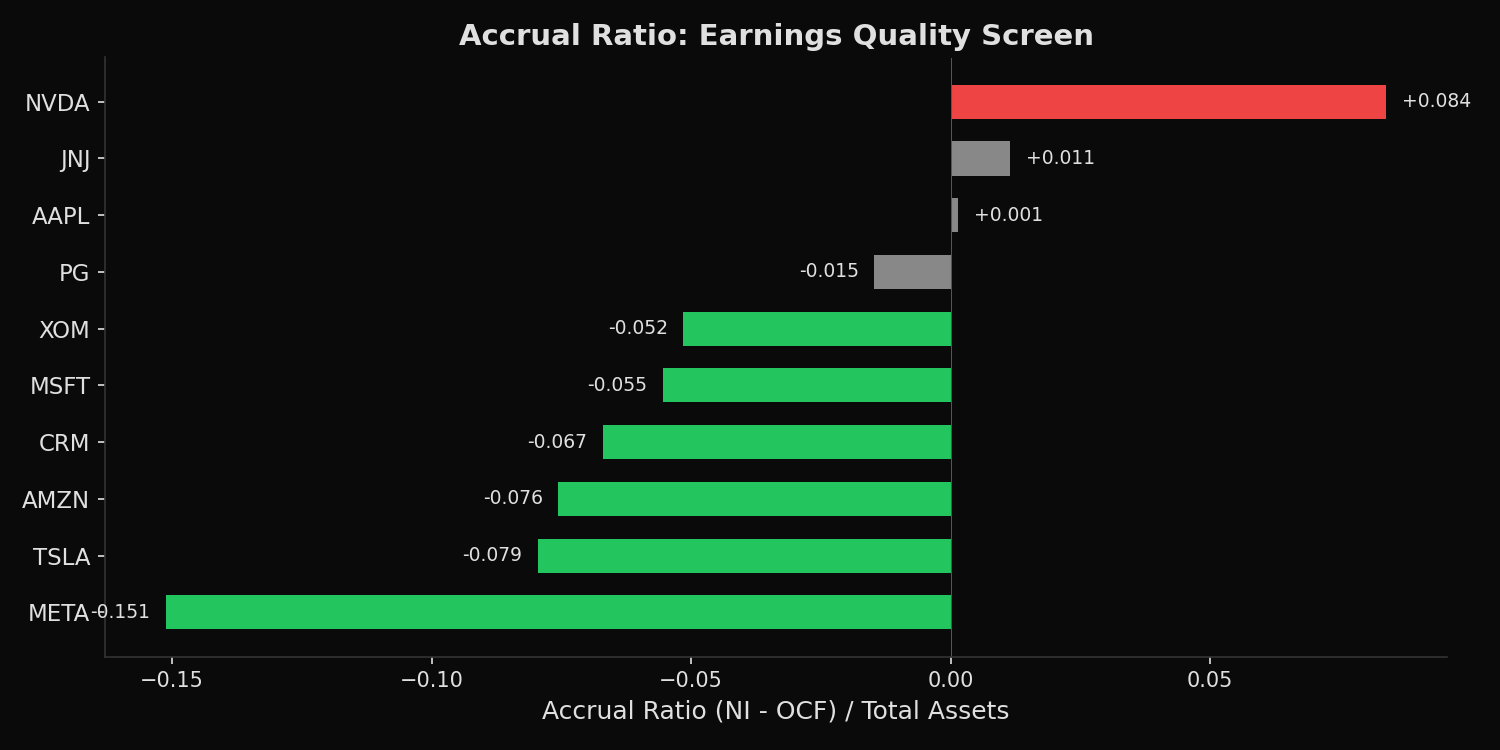
NVDA    NI=   120B  OCF=   103B  Assets=   207B  accrual=+0.084
JNJ     NI=    27B  OCF=    25B  Assets=   199B  accrual=+0.011
AAPL    NI=   112B  OCF=   111B  Assets=   359B  accrual=+0.001
PG      NI=    16B  OCF=    18B  Assets=   125B  accrual=-0.015
XOM     NI=    29B  OCF=    52B  Assets=   449B  accrual=-0.052
MSFT    NI=   102B  OCF=   136B  Assets=   619B  accrual=-0.055
CRM     NI=     6B  OCF=    13B  Assets=   103B  accrual=-0.067
AMZN    NI=    78B  OCF=   140B  Assets=   818B  accrual=-0.076
TSLA    NI=     4B  OCF=    15B  Assets=   138B  accrual=-0.079
META    NI=    60B  OCF=   116B  Assets=   366B  accrual=-0.151
What this tells us
META produces the highest-quality earnings in this group with an accrual ratio of -0.151, meaning its operating cash flow exceeds net income by 15.1% of total assets. This reflects Meta’s asset-light advertising business model where revenue is collected in cash before expenses are recognized. NVDA stands at the opposite end with an accrual ratio of +0.084 — net income exceeds operating cash flow by 8.4% of total assets. This positive ratio reflects the timing mismatch inherent in NVDA’s business: large GPU orders generate revenue recognition upon shipment, while cash collection and working capital cycles lag. It does not necessarily indicate accounting manipulation, but it does mean NVDA’s reported earnings are less conservative than META’s. AMZN at -0.091 benefits from its negative working capital cycle — customers pay before Amazon pays suppliers — which structurally drives cash flow above net income.
So what?
The accrual ratio is a first-pass screen for earnings quality, not a definitive verdict. A positive ratio in isolation does not mean a company is manipulating earnings — it may reflect legitimate business model characteristics such as long-term contracts (revenue recognized over time while costs are paid upfront) or rapid growth (inventory and receivables growing faster than payables). The actionable application is comparative: when two companies in the same industry report similar earnings growth but one has a significantly higher accrual ratio, the company with lower accrual quality is more likely to experience negative earnings surprises in subsequent quarters. Combining the accrual ratio with free cash flow yield and revenue growth provides a more robust earnings quality framework than any single metric alone.
pip install xfinlink