BLOG

Behind the numbers.

Code examples, market analysis, and data quality deep-dives.

Are Power Stocks Becoming an AI Infrastructure Trade? Momentum Screening in Python
Which AI Chip Stocks Have Margin Momentum? Profitability Trend Analysis in Python
Which AI Stocks Are Cheapest Relative to Growth? Growth-Adjusted Valuation in Python
Does AI Stock Leadership Persist? Momentum Backtest in Python
Which AI Stocks Have the Cleanest Balance Sheets? Net Cash Screening in Python
Can Risk Parity Reduce Mega-Cap Drawdowns? Portfolio Optimization in Python
Which Growth Stocks Are Self-Funding? Cash-Flow Quality Screening in Python
Which Sectors Struggle When the Dollar Rallies? Sector Rotation Analysis in Python
Do Cheap Stocks Hold Up When Bonds Sell Off? Valuation Rotation in Python
Does the Nasdaq 100 Have Better Growth Quality Than the Dow? Index Constituent Analysis in Python
Do Healthcare Cash-Flow Margins Predict Returns? Signal Evaluation in Python
Which Dividend Stocks Survive a Cash-Flow Stress Test? Dividend Screening in Python
Does Heavy Insider Selling Predict Weak Returns? Insider Flow Test in Python
Can Quality Screens Reduce Small-Cap Balance-Sheet Risk? Russell 2000 Test in Python
Which Retailers Have Positive Operating Leverage? Margin Screening in Python
Is MSTR a Leveraged Bitcoin Proxy? Rolling Beta Analysis in Python
Is Micron's Memory Cycle Recovering? Inventory and Margin Forecasting in Python
Which Sectors Work When Bonds Rally? Rate-Sensitive Rotation in Python
Do One-Month Price Extremes Reverse? Signal Evaluation in Python
Do Low-Volatility S&P 500 Stocks Reduce Drawdowns? Factor Test in Python
Is AI Capex Paying Back Fast Enough? Revenue Hurdle Forecasting in Python
Could Shorter AI Asset Lives Hit Earnings? Depreciation Stress Test in Python
How Much AI Capex Risk Can a Portfolio Remove? Constrained Optimization in Python
Is the AI Capex Trade Crowded? Rolling Volatility and Sector Rotation in Python
Did the AI Boom Come From Existing S&P 500 Members? Point-in-Time Momentum Test in Python
Is AI Revenue Circular? Customer-Vendor Capex Loop Analysis in Python
Is the AI Trade Connected to Private Credit? Rolling Correlation Network in Python
Is Apollo More Balance-Sheet Sensitive Than Peers? Leverage Screen in Python
Are AI Earnings Supported by Cash Flow? Accrual and Capex Screen in Python
Can Defensive Stocks Hedge AI Drawdowns? Basket Regime Test in Python
How Fast Does the Market Price In Fed Decisions? FOMC Event Study in Python
How Much Are Options Sellers Overpaid? The Variance Risk Premium in Python
Which Companies Have the Worst Earnings Quality? Sloan Accrual Screen with Geographic Revenue Data in Python
Does the Oil-to-Gold Ratio Signal Recessions? XLE/GLD Backtest in Python
Is AI Spending Crowding Out Free Cash Flow? Capex Sustainability Across the Mag 7 in Python
Does a Long Energy / Short Bonds Portfolio Capture Inflation Surprises? Factor Construction in Python
Can a Hidden Markov Model Detect Oil Market Regimes? HMM Analysis in Python
Do Grain Prices Predict Food Inflation? Granger Causality Test in Python
Does the Corporate Credit Spread Predict Stock Market Crashes? BAA-AAA Spread Analysis in Python
Do Oil Stocks Hedge Inflation? Rolling Beta Analysis in Python
Which Stocks Are Most Rate-Sensitive? Equity Duration via Bond Beta in Python
Which Companies Have the Highest Accrual Ratios? Earnings Quality Screening in Python
Is Alpha Persistent or Decaying? Rolling Sharpe Ratio Analysis in Python
Are Markets Trending or Mean-Reverting? Hurst Exponent Analysis in Python
Is Consumer Discretionary vs Staples a Leading Indicator? XLY/XLP Ratio Analysis in Python
Does Heavy Capex Predict Future Stock Returns? Capital Expenditure Analysis in Python
How to Estimate Cost of Equity Using CAPM in Python
Is Volatility Predictable? Testing for Volatility Clustering in Python
Which Industrials Are Overleveraged? Net Debt to EBITDA Screening in Python
GM Before and After Bankruptcy: Why Entity Resolution Matters for Financial Data
What Is Adjusted Beta? Merrill Lynch Beta Shrinkage in Python
How Good Is a Stock Pick? Information Ratio and Tracking Error in Python
Do Stock Returns Follow a Normal Distribution? Testing for Fat Tails in Python
Which Large Caps Have the Highest Free Cash Flow Yield? FCF Screening in Python
Which Sectors Won Over 5 Years? Sector Rotation Analysis in Python
How to Forecast Stock Volatility with GARCH Models in Python
Are Stock Prices Mean-Reverting? Augmented Dickey-Fuller Test in Python
How to Calculate CAPM Alpha and Beta with Regression in Python
How to Compare Sector Sharpe Ratios and Sortino Ratios in Python
DELL: Why Stitching Historical Price Data Together Is Wrong
How to Analyze Drawdown and Recovery for Bank Stocks in Python
How to Screen SaaS Stocks by Revenue Growth and Cash Flow in Python
How to Screen REITs by Dividend Yield and Valuation in Python
How Correlated Are the Magnificent 7? Intra-Group Correlation in Python
AAPL vs XOM: Do Individual Stocks Have Seasonal Patterns?
How to Rank Large-Cap Stocks by Momentum in Python
How to Build a Multi-Endpoint Financial Dashboard in Python
How to Compare Volatility Across Energy Stocks in Python
How to Screen Healthcare Stocks by Valuation in Python
How to Build a Sector Correlation Matrix for Portfolio Diversification in Python
How to Find Oversold and Overbought Stocks Using Z-Scores in Python
How to Measure Earnings Quality: Cash Flow vs Net Income in Python
How to Build a Multi-Factor Stock Screen in Python (Value + Momentum + Quality)
How to Build a Simple DCF Model for Any Stock in Python
How to Screen Tech Stocks by Revenue Growth in Python
How to Screen Stocks by Balance Sheet Health in Python
Is "Sell in May" Real? SPY Monthly Seasonality Over 10 Years
How to Compare Sector Performance YTD Using Python
How to Track S&P 500 Additions and Removals Over Time in Python
How to Screen Dividend Stocks by Yield and Quality in Python
How to Calculate Max Drawdown and Recovery Time for Any Stock in Python
How to Compare Profitability Across Mega-Cap Tech Stocks in Python
Why Ticker Symbols Are Unreliable: The Recycling Problem Every Quant Should Know
How to Calculate and Compare Stock Volatility in Python
How to Screen Blue-Chip Stocks by P/E Ratio in Python
How to Track Companies Through Ticker Changes, Bankruptcies, and Renames in Python
S&P 500 Turnover: How Much the Index Has Changed Since 2010
How to Calculate Stock Beta and Correlation in Python
← All articles

Are Power Stocks Becoming an AI Infrastructure Trade? Momentum Screening in Python

What's the question?

Artificial intelligence is changing the demand story for power. Data centers require electricity, grid interconnection, backup generation, cooling, transformers, and large-scale engineering work. The investment question is whether the market is treating this as one broad power trade or separating the winners from the rest of the utility and infrastructure universe.

Momentum is the tendency for recent winners to keep outperforming over a short to medium horizon. It is useful here because AI-related infrastructure demand is partly an expectations trade. If investors are repricing companies exposed to grid expansion and data-center power demand, the effect should appear in relative returns before it appears fully in reported financial statements.

The question is practical: which power and electrification stocks are actually carrying the AI infrastructure narrative, and which are not?

The approach

The universe is CEG, VST, NRG, ETN, PWR, GEV, NEE, SO, DUK, and AEP. It includes power producers, regulated utilities, electrical equipment, and engineering firms. Built from SEC EDGAR public filings and market data, the screen combines one year of daily returns with latest trailing-twelve-month fundamentals.

  1. Pull one year of daily adjusted prices
  2. Calculate one-year return, annualized volatility, and maximum drawdown
  3. Pull latest revenue growth, P/E ratio, and market capitalization
  4. Rank companies by one-year return
  5. Compare price momentum with revenue growth and valuation

Maximum drawdown is the largest peak-to-trough loss over the sample. It matters because several power-linked stocks have high narrative exposure and high volatility at the same time.

Code

import xfinlink as xfl
import pandas as pd
import numpy as np

xfl.set_api_key("YOUR_API_KEY")  # free at https://xfinlink.com/signup

tickers = ["CEG", "VST", "NRG", "ETN", "PWR", "GEV", "NEE", "SO", "DUK", "AEP"]
prices = xfl.prices(tickers, period="1y", fields=["adj_close", "return_daily"])
pivot = prices.pivot_table(index="date", columns="ticker", values="adj_close").dropna()
returns = pivot.pct_change().dropna()

metrics = xfl.metrics(tickers, period_type="ttm", fields=["market_cap", "revenue_growth", "pe_ratio"])
latest = metrics.sort_values("period_end").groupby("ticker").tail(1).set_index("ticker")

rows = []
for ticker in tickers:
    price = pivot[ticker]
    rows.append({
        "ticker": ticker,
        "return_1y": price.iloc[-1] / price.iloc[0] - 1,
        "volatility": returns[ticker].std() * np.sqrt(252),
        "max_drawdown": (price / price.cummax() - 1).min(),
        "revenue_growth": latest.loc[ticker, "revenue_growth"],
        "pe_ratio": latest.loc[ticker, "pe_ratio"],
    })

print(pd.DataFrame(rows).sort_values("return_1y", ascending=False))

Full script with formatting and visualisation: ai-power-infrastructure-momentum-python.py

Output

One-year returns for power, grid, and electrification stocks linked to AI infrastructure demand
=== AI Power Infrastructure Momentum Screen ===
Universe: 10 power, grid, and electrification stocks
Sample: 2025-06-17 to 2026-06-16 (251 trading days)
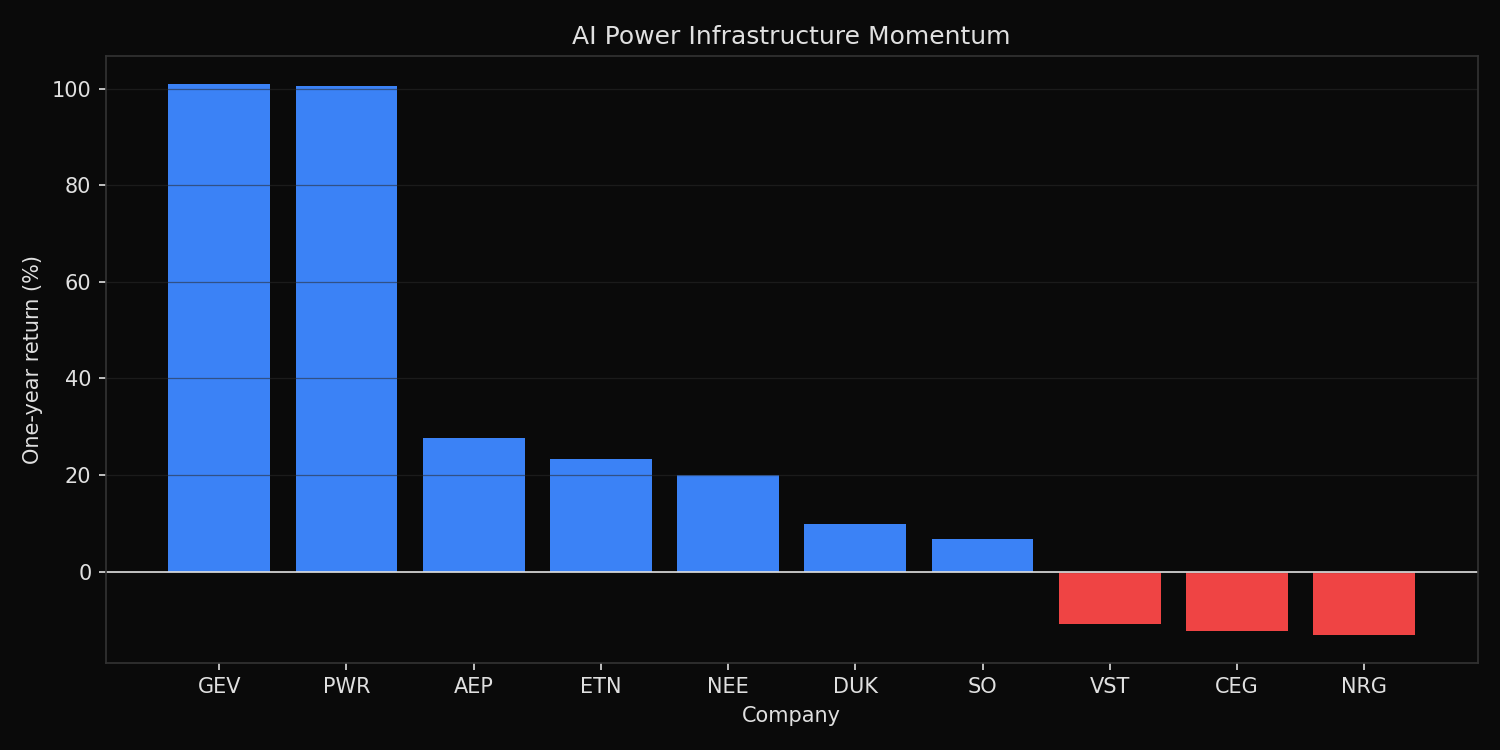
Top 1-year return: GEV +101.0%
Median 1-year return: +14.9%
Median revenue growth: +10.6%

Ticker ranking:
GEV  return=+101.0%  vol=49.4%  max_drawdown=-24.6%  rev_growth=10.3%  PE=  28.7  market_cap=$264.0B
PWR  return=+100.6%  vol=37.3%  max_drawdown=-17.1%  rev_growth=21.1%  PE=  98.7  market_cap=$107.9B
AEP  return=+27.7%  vol=18.3%  max_drawdown= -9.7%  rev_growth= 7.2%  PE=  19.2  market_cap=$70.6B
ETN  return=+23.4%  vol=33.4%  max_drawdown=-19.6%  rev_growth=12.7%  PE=  39.9  market_cap=$158.3B
NEE  return=+20.0%  vol=23.6%  max_drawdown=-14.5%  rev_growth= 7.5%  PE=  21.9  market_cap=$179.8B
DUK  return= +9.8%  vol=14.8%  max_drawdown=-11.6%  rev_growth= 5.8%  PE=  19.3  market_cap=$98.1B
SO   return= +6.7%  vol=16.2%  max_drawdown=-15.7%  rev_growth= 8.3%  PE=  24.1  market_cap=$106.3B
VST  return=-10.8%  vol=49.0%  max_drawdown=-38.2%  rev_growth=15.7%  PE=  26.5  market_cap=$53.6B
CEG  return=-12.3%  vol=46.8%  max_drawdown=-40.0%  rev_growth=21.6%  PE=  23.3  market_cap=$97.0B
NRG  return=-13.1%  vol=45.2%  max_drawdown=-34.4%  rev_growth=10.9%  PE= 143.6  market_cap=$28.1B

What this tells us

The AI power trade is not moving as a single block. GEV and PWR both doubled over the last year, while VST, CEG, and NRG fell despite double-digit revenue growth. The strongest returns are in electrification equipment and infrastructure services, not in every company associated with power generation.

The risk profile is also uneven. GEV returned 101.0% but had 49.4% annualized volatility and a 24.6% drawdown. PWR returned 100.6% with lower volatility and a smaller drawdown. The regulated utilities are steadier: AEP, DUK, SO, and NEE show lower volatility and smaller drawdowns, but their returns are also lower.

Revenue growth alone does not explain the ranking. CEG has the highest revenue growth in the group at 21.6%, yet it has a negative one-year return. PWR has similar revenue growth and a strongly positive return. The market is assigning different value to different links in the AI infrastructure chain.

So what?

AI power exposure should be decomposed before it is added to a portfolio. Equipment manufacturers, engineering firms, regulated utilities, and merchant power producers carry different growth, valuation, and drawdown profiles. Treating them as one theme hides the actual risk.

The practical screen is simple: combine momentum with revenue growth and valuation. A stock with strong momentum and improving fundamentals deserves further research. A stock with strong fundamentals but weak momentum may still be early, but it requires a different entry discipline. The AI infrastructure trade is real, but the market is already separating the supply chain.

Built with xfinlink — free financial data API for Python. pip install xfinlink

Built with xfinlink — free financial data API for Python. pip install xfinlink
← All articles