
What’s the question?
BlackRock, Vanguard and State Street together hold roughly a quarter of every large American company. A familiar argument follows: index funds buy and sell whole baskets rather than single businesses, so the companies they own most heavily should trade less on their own news and more on the market’s. If that holds, index sensitivity can be read off the share register.
Two numbers settle whether a stock moves with the market. Beta is the slope from regressing a stock’s daily returns on the index’s: a beta of 1.3 means the stock moved 1.3% on a day the index moved 1%. R-squared is the fraction of a stock’s daily variation the index accounts for, and it is the better measure of “moves as a bloc”, since a high-beta stock can still spend most of its variance on its own news.
Ownership is observable: any US manager holding more than $100m in listed equities files Form 13F within 45 days of each quarter end, naming every position. So sort the S&P 500 by how much of each company the three largest index managers own, then look at beta and R-squared over the next year. The books of the same managers, tracked for concentration over many years, feed a Form 13F concentration analysis.
The approach
- Take the S&P 500 roster as it stood on 31 December 2024, carrying each company by entity id so a reassigned ticker cannot enter the sample.
- Pull the full Form 13F book of BlackRock, Vanguard and State Street for that quarter, discard option positions, fold a second share class into its issuer, and sum reported value by company.
- Divide that sum by the company’s market value on the same day for the combined stake.
- Regress each company’s 2025 daily price returns on SPY, which yields beta, R-squared, and the annualised standard deviation of the residual.
- Sort into quintiles, then rerun the cross-section with log market value and sector indicators alongside the stake.
Ownership is measured before the return window, so the sort could have been run in real time. Two screens apply: a stake outside 2% to 40% of market value indicates a reported value and a share count on different bases, and a stable beta needs 200 trading days of history.
Code
import numpy as np
import pandas as pd
import statsmodels.api as sm
import xfinlink as xfl

xfl.set_api_key("YOUR_API_KEY")  # free at https://xfinlink.com/signup

Q = "2024-12-31"
BIG3 = {2432: "BlackRock", 10139: "Vanguard", 486: "State Street"}

roster = xfl.index("sp500", as_of=Q).drop_duplicates("entity_id")
books = pd.concat([
    xfl.manager_holdings(mid, quarter=Q, max_rows=20000,
                         fields=["entity_id", "entity_name", "value_usd", "put_call"])
    for mid in BIG3
])
books = books[books["put_call"].isna()]

# a second share class files under its own entity; fold it into the issuer
root = roster[["entity_id", "entity_name"]].rename(
    columns={"entity_id": "issuer_id", "entity_name": "root"})
extra = books.loc[~books["entity_id"].isin(set(roster["entity_id"])),
                  ["entity_id", "entity_name"]].drop_duplicates()
pairs = extra.merge(root, how="cross")
pairs = pairs[[c.upper().startswith(r.upper() + " ")
               for c, r in zip(pairs["entity_name"], pairs["root"])]]
books["entity_id"] = books["entity_id"].replace(
    dict(zip(pairs["entity_id"], pairs["issuer_id"])))
big3 = books.groupby("entity_id")["value_usd"].sum().rename("big3_value").reset_index()

tick = roster["ticker"].tolist()
caps = pd.concat([
    xfl.metrics(tick[i:i + 100], period_type="daily", fields=["market_cap"],
                start="2024-12-24", end=Q, max_rows=20000)
    for i in range(0, len(tick), 100)
])
caps = caps.sort_values("period_end").groupby("entity_id").tail(1)
caps["mcap"] = caps["market_cap"] * 1e6

df = roster.merge(big3, on="entity_id", how="left").merge(
    caps[["entity_id", "mcap"]], on="entity_id")
df["own"] = df["big3_value"] / df["mcap"]
df = df[df["own"].between(0.02, 0.40)]

ids = sorted(int(e) for e in df["entity_id"])
px = pd.concat([
    xfl.prices(entity_id=ids[i:i + 40], start="2024-12-24", end="2025-12-31",
               fields=["adj_close"], max_rows=60000)
    for i in range(0, len(ids), 40)
])
spy = xfl.prices("SPY", start="2024-12-24", end="2025-12-31", fields=["adj_close"])
mkt = spy.sort_values("date").set_index("date")["adj_close"].pct_change().rename("mkt")

rows = []
for eid, g in px.groupby("entity_id"):
    r = g.sort_values("date").set_index("date")["adj_close"].pct_change().rename("r")
    j = pd.concat([r, mkt], axis=1, sort=False).dropna()
    if len(j) < 200:
        continue
    beta = np.cov(j["r"], j["mkt"])[0, 1] / np.var(j["mkt"], ddof=1)
    resid = j["r"] - beta * j["mkt"]
    rows.append({"entity_id": eid, "beta": beta,
                 "r2": j["r"].corr(j["mkt"]) ** 2,
                 "total_vol": j["r"].std() * np.sqrt(252),
                 "idio_vol": resid.std() * np.sqrt(252)})

res = df.merge(pd.DataFrame(rows), on="entity_id")
res["sector"] = res["entity_id"].map(px.drop_duplicates("entity_id")
                                     .set_index("entity_id")["gics_sector"])
res["logcap"] = np.log(res["mcap"])
res["q"] = pd.qcut(res["own"], 5, labels=[1, 2, 3, 4, 5])

print(res.groupby("q", observed=True).agg(
    n=("ticker", "size"), own=("own", "mean"), beta=("beta", "mean"),
    r2=("r2", "mean"), idio_vol=("idio_vol", "mean")))

dummies = pd.get_dummies(res["sector"], drop_first=True).astype(float).reset_index(drop=True)
for y in ("beta", "r2", "idio_vol"):
    plain = sm.OLS(res[y], sm.add_constant(res[["own"]])).fit()
    X = pd.concat([sm.add_constant(res[["own", "logcap"]]).reset_index(drop=True),
                   dummies], axis=1)
    full = sm.OLS(res[y].reset_index(drop=True), X).fit()
    print(y, round(plain.params["own"], 3), round(plain.tvalues["own"], 2),
          round(full.params["own"], 3), round(full.tvalues["own"], 2))
Full script with formatting and visualisation: index-fund-ownership-stock-beta-python.py
Output
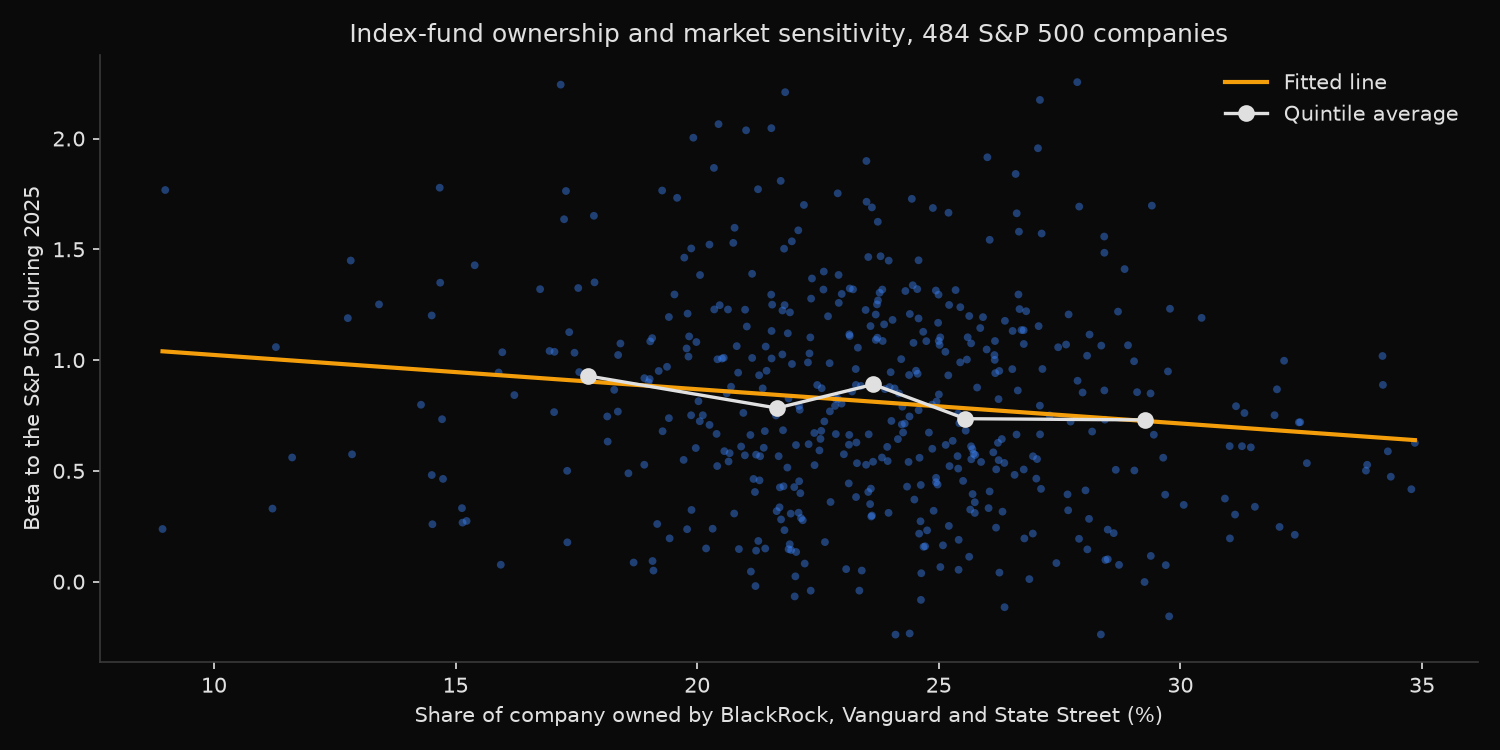
Big Three ownership and market sensitivity, S&P 500
  index members priced at 2024-12-31                   498
  no matched Form 13F position                    4
  stake outside 2-40% of market value             4
  fewer than 200 trading days in 2025             6
  companies in the sample                       484

Combined stake: mean 23.6%, median 23.6%, range 8.9% (TMUS) to 34.9% (ESS)
Correlation with log market cap: -0.402

Quintiles of Big Three ownership, sorted low to high
Quintile     n   Owned    Beta    R-sq     Vol  Idio vol   Median cap
---------------------------------------------------------------------
1           97   17.7%    0.93    0.31   33.6%     27.4%       73.7bn
2           97   21.7%    0.78    0.25   31.4%     26.6%       81.0bn
3           96   23.6%    0.89    0.30   33.3%     27.5%       39.9bn
4           97   25.5%    0.74    0.22   32.7%     28.5%       25.2bn
5           97   29.3%    0.73    0.23   30.9%     26.5%       22.3bn

Cross-sectional regression, coefficient on ownership share
Dependent variable            Ownership only       + size + sector
------------------------------------------------------------------
Market beta                -1.547 (t -2.94)     -1.481 (t -2.57)
R-squared                  -0.474 (t -2.46)     -0.124 (t -0.59)
Idiosyncratic vol          -0.121 (t -1.17)     -0.259 (t -2.10)

Sector means
  Real Estate               31   31.5%    0.57
  Utilities                 30   26.5%    0.41
  Energy                    21   24.3%    0.96
  Information Technology    66   23.6%    1.31
  Materials                 28   23.4%    0.93
  Health Care               57   23.3%    0.61
  Industrials               78   22.7%    0.89
  Financials                68   22.3%    0.83
  Consumer Discretionary    50   22.1%    0.95
  Consumer Staples          37   22.0%    0.26
  Communication Services    18   21.0%    0.75
What this tells us
The claim fails, and in the direction opposite to the one predicted. Beta declines as index-fund ownership rises, 0.93 in the lightest quintile against 0.73 in the heaviest, at a slope of -1.547 with a t-statistic of -2.94. Log market value and sector indicators barely move it, to -1.481 with a t-statistic of -2.57. The effect is small: the 11.6 percentage points separating the extreme quintiles are worth about 0.17 of beta, and betas run from near zero to above two at every ownership level.
R-squared is the more direct refutation. Sorted alone it falls from 0.31 to 0.23, at -0.474 with a t-statistic of -2.46, but size and sector controls drop that to -0.124 with a t-statistic of -0.59. The index explains no more of a heavily index-owned company’s daily variation than of a lightly owned one.
The reason sits in what the ownership share measures. Every S&P 500 member is inside the same index funds at close to its market weight, so the passive slice barely varies as a fraction of the shares those funds can buy. What varies is the rest of the register. Ownership runs highest in Real Estate at 31.5% and Utilities at 26.5%, where average betas are 0.57 and 0.41, and lowest where a strategic holder owns a block, as with T-Mobile US at 8.9%, majority-owned by Deutsche Telekom. It is a float and sector marker in the costume of a crowding measure.
So what?
Ownership share should not be used as a proxy for index sensitivity. A beta from one year of daily returns costs one covariance and one variance; the 13F register measures who is on it.
For a stock picker the useful column is idiosyncratic volatility, flat at 27.4%, 26.6%, 27.5%, 28.5% and 26.5% across the quintiles. Company-specific movement, the raw material research works on, does not shrink as index funds take more of the register. Dropping heavily index-owned names in search of more fertile ground drops Real Estate and Utilities and gains nothing.
None of this settles the wider argument about passive investing. It settles the cross-sectional version, in which the companies index funds own most heavily trade most like the index. Testing the rest means working on flows in the time series, not on a snapshot of who owns what.
Built with xfinlink — free financial data API for Python.