
What’s the question?
The index effect is the claim that membership itself moves a price. When a company joins a major index, every fund tracking it has to buy, and the buying concentrates into the days around one announced date; deletion runs the other way. Price-pressure studies in the mid-1980s found large, dateable moves around S&P 500 changes, which became one of the standard arguments that demand curves for individual stocks slope downward.
Forty years later the conditions have changed. Index funds are far larger, which should strengthen the pressure, but the trades are also far better anticipated, and a move everyone expects gets arbitraged away before it happens. The Nasdaq-100 is a useful place to test what survives, because it admits companies near the top of the market-cap distribution and drops the smallest. If index demand still moves prices, the two sides should not move by the same amount.
An abnormal return is a stock’s return minus a benchmark’s over the same day, cumulated across the window. The benchmark here is QQQ, the fund that has to do the trading.
The approach
- Pull the Nasdaq-100 membership change log for 2014 to 2026, which returns one dated row per addition and per removal
- Pull daily prices around each event addressed by entity id rather than by ticker, so a symbol later reassigned to a different company cannot enter the window
- Line every event up on a common axis running from 19 sessions before the effective date to 60 sessions after
- Subtract the QQQ return day by day and cumulate, giving one abnormal-return path per event
- Average the paths separately for additions and removals, reporting medians alongside means
The log holds 236 events, 119 additions and 117 removals, of which 164 carry both an effective date on a trading session and a price series spanning the window. The surviving sample is lopsided, 111 additions against 53 removals, for a structural reason: a company removed because it was acquired or stopped trading has no post-event window to measure. That filter runs in favour of the removals that remain.
Code
import numpy as np
import pandas as pd
import xfinlink as xfl

xfl.set_api_key("YOUR_API_KEY")  # free at https://xfinlink.com/signup

PRE, POST = 20, 60

events = xfl.index_events("ndx100", start="2014-01-01", end="2026-08-19")
events["effective_date"] = pd.to_datetime(events["effective_date"])

frames = []
for year, group in events.groupby(events["effective_date"].dt.year):
    ids = sorted(group["entity_id"].dropna().unique().tolist())
    for i in range(0, len(ids), 60):
        frames.append(xfl.prices(entity_id=ids[i:i + 60],
                                 start=f"{year - 1}-09-01", end=f"{year + 1}-06-30",
                                 fields=["adj_close"], max_rows=300000))
px = pd.concat(frames, ignore_index=True)
px["date"] = pd.to_datetime(px["date"])

bench = xfl.prices(["QQQ"], start="2014-01-01", end="2026-08-19",
                   fields=["adj_close"], max_rows=300000)
bench["date"] = pd.to_datetime(bench["date"])
bench = bench.set_index("date")["adj_close"].sort_index()
bench_ret, sessions = bench.pct_change(), bench.index

paths = {"added": [], "removed": []}
for row in events.itertuples():
    stock = px[px["entity_id"] == row.entity_id].set_index("date")["adj_close"]
    stock = stock[~stock.index.duplicated(keep="last")].sort_index()
    if row.effective_date not in sessions:
        continue
    day0 = sessions.get_loc(row.effective_date)
    if day0 - PRE < 0 or day0 + POST >= len(sessions):
        continue
    window = sessions[day0 - PRE:day0 + POST + 1]
    r = stock.reindex(window).pct_change()
    if r.iloc[1:].isna().sum() > 5:
        continue
    abnormal = (r - bench_ret.reindex(window)).fillna(0).values[1:]
    paths[row.event_type].append(np.cumsum(abnormal) * 100)

added, removed = np.vstack(paths["added"]), np.vstack(paths["removed"])
axis = list(range(-PRE + 1, POST + 1))
for day in (-1, 1, 5, 20, 60):
    a, b = added[:, axis.index(day)], removed[:, axis.index(day)]
    print(f"day {day:+3d}  added {a.mean():6.2f} / {np.median(a):6.2f}   "
          f"removed {b.mean():6.2f} / {np.median(b):6.2f}")
Full script with formatting and visualisation: nasdaq-100-reconstitution-event-study-python.py
Output
benchmark QQQ: 3175 sessions, 2014-01-02 to 2026-08-19, largest gap 4 days

Nasdaq-100 changes 2014 to 2026: 236 logged, 111 additions and 53 removals with a usable window
  dropped, off session: 49
  dropped, window off the edge: 0
  dropped, series incomplete: 23

Cumulative abnormal return against QQQ, per cent
         window  added mean   median  removed mean   median
  day -19 to -1        1.89     1.29          1.44    -0.09
  day -19 to +1        1.45    -0.50          1.65     0.60
  day -19 to +5        0.89     0.40          1.71     1.15
 day -19 to +20        1.61    -1.32          6.19     3.78
 day -19 to +60        0.76    -0.18          4.11     1.94

Post-event drift, day +1 to day +60, per cent
  added    mean  -0.69   median  -0.28   positive on 50% of events
  removed  mean   2.46   median   1.15   positive on 58% of events
What this tells us
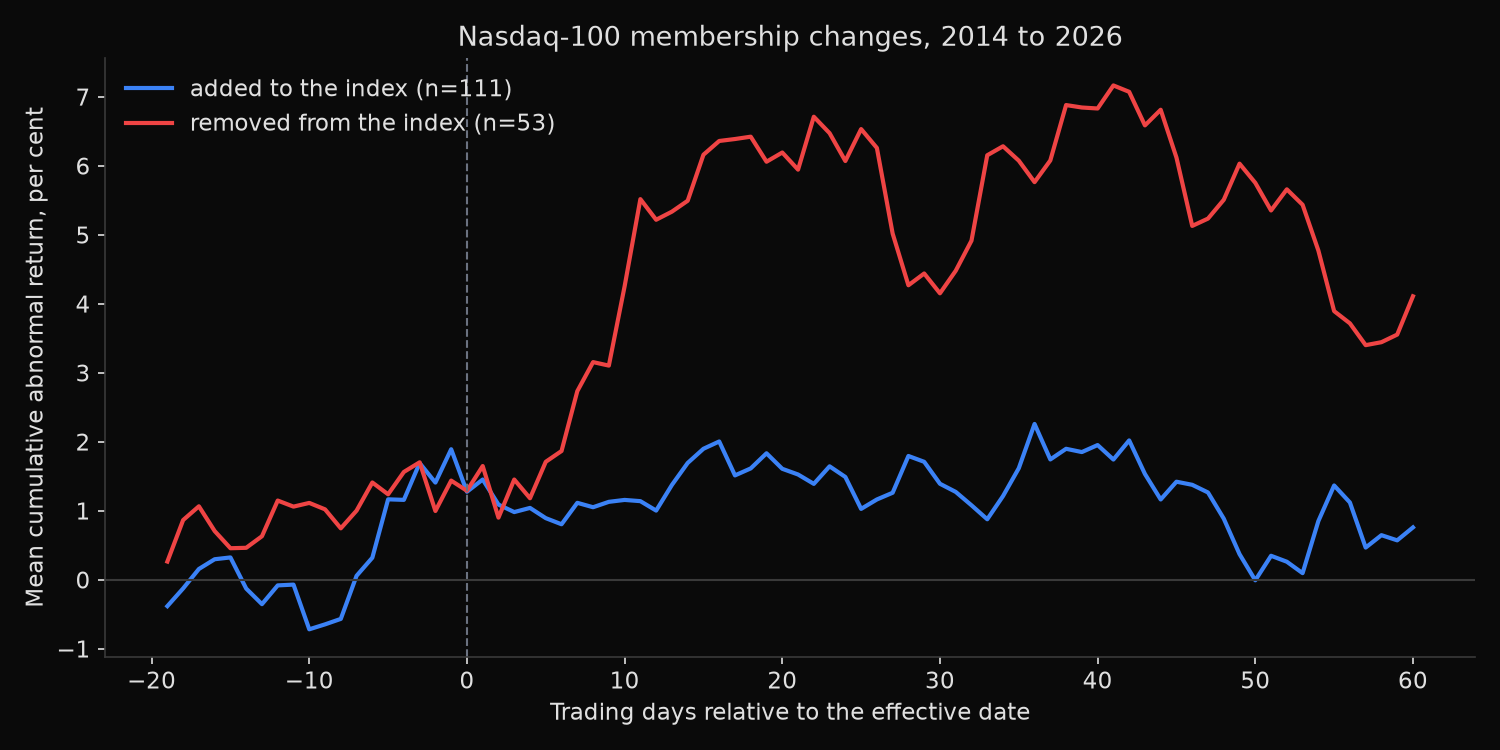
The addition effect is gone. A company joining the Nasdaq-100 earns a mean cumulative abnormal return of 0.76% by day 60 and a median of −0.18%, and the post-event drift is positive on exactly 50% of events. Nothing in the addition path clears the noise at any point in the window, and the median sits below zero at three of the five horizons. The classic result, a jump into the effective date followed by a partial giveback, does not appear here. The same question is asked of the S&P 500 in an event study of its additions.
Deletions behave differently, and the move happens after the event rather than before. The median removal is flat going in, at −0.09% the day before the effective date, then gains 3.78% against QQQ by day 20, with a mean of 6.19%; most of it accrues between day 5 and day 20 rather than at the event itself. By day 60 half has decayed, to a median 1.94%. The mean runs above the median at every post-event horizon, so a minority of large rebounds carries the average, and the drift is positive on 58% of events, a majority but not a reliable one.
The asymmetry is about float rather than flows. A company entering the Nasdaq-100 is near the top of the market-cap distribution, so the shares index funds must buy are a small fraction of a very large float and the price barely notices. A company leaving is the smallest member, and the same funds are selling a much larger fraction of a much smaller float. Concentrated selling into a thin book pushes the price below where it would otherwise sit, and the discount unwinds as the flow stops.
One caveat belongs on the removal figure. Only removals whose company kept trading for another quarter can be measured, which excludes acquisitions and delistings and selects on survival. The rebound is real for the 53 names that stayed listed; it is not available on every deletion. On the S&P 500, a study of one-for-one swaps sorts removals by whether the company kept trading.
So what?
There is no trade in buying an addition. Whatever pressure once existed at the top of the Nasdaq-100 has been arbitraged flat, and front-running index buying pays costs for a payoff that does not arrive.
The deletion side still moves, and the use is defensive rather than speculative. A portfolio that mechanically sells a name on the day it leaves an index sells into the window where the discount is deepest, and the 3.78% median recovery over the following month measures what that rule gives away. Staggering the exit across the weeks after the effective date recovers part of it.
The same point applies to a backtest. A universe rule that drops deleted names at the effective date is not neutral bookkeeping; it books the discount as a realised loss and misses the reversal. Re-running with a delayed exit separates the real result from the rebuild artefact.
Built with xfinlink — free financial data API for Python.