
Does Last Quarter’s Best Sector Stay on Top? Sector Rank Persistence in Python
September 15, 2026
What’s the question?
Sector rotation is the practice of shifting money between industry groups rather than between individual stocks. It rests on an assumption that is rarely stated out loud: that the ordering of sector performance carries forward. A rule that buys whichever sector led last quarter works only if leading last quarter says something about leading next quarter.
The assumption is testable. Rank the sectors every quarter from best to worst, then measure how closely this quarter’s ordering matches the next one. The Spearman rank correlation does that comparison; it ignores the size of the returns and reads only the order, giving +1 when the ordering repeats exactly, 0 when the two orderings are unrelated, and -1 when it flips end to end.
The prize is real whatever the answer: across the sample below, the gap between the best and the worst sector in a single quarter averages 19.0 points.
The approach
Nine Select Sector SPDR funds carry the test: Materials, Energy, Financials, Industrials, Technology, Consumer Staples, Utilities, Health Care and Consumer Discretionary. Two further sector funds began trading long after 1999, and including them would cut the window down to the shortest series available. These nine priced on every session across it, which matters because a rank is meaningful only when every competitor is present. The window runs from 1 January 1999 to 31 December 2024: 104 quarters.
- Compound daily total returns inside each calendar quarter, then rank the nine funds 1 to 9 on that return.
- Compute the Spearman correlation between the ranking in quarter t and the ranking in quarter t+h for horizons of 1, 2, 4 and 8 quarters. Each pair of quarters gives one correlation, and a one-sample t-test asks whether their average differs from zero.
- Repeat the measurement on realised volatility. Volatility is known to persist, so it acts as a control: a flat reading on returns then means the ordering is absent, not that the method cannot see it.
- Count how often the best fund of one quarter is also the best of the next, against the 11.1% that chance produces, and rank at monthly and annual frequency in case the quarter is the wrong unit.
Code
import numpy as np
import xfinlink as xfl
from scipy import stats

xfl.set_api_key("YOUR_API_KEY")  # free at https://xfinlink.com/signup

TICKERS = ["XLB", "XLE", "XLF", "XLI", "XLK", "XLP", "XLU", "XLV", "XLY"]

raw = xfl.prices(TICKERS, start="1998-12-01", end="2024-12-31",
                 fields=["close", "adj_close", "return_daily"], max_rows=200000)

daily = raw.dropna(subset=["return_daily"])
piv = daily.pivot(index="date", columns="ticker", values="return_daily")[TICKERS]
qtr = piv.index.to_period("Q")

ret = piv.groupby(qtr).apply(lambda x: (1 + x).prod() - 1).loc["1999Q1":"2024Q4"]
vol = (piv.groupby(qtr).std() * np.sqrt(252)).loc["1999Q1":"2024Q4"]

ret_rank = ret.rank(axis=1, ascending=False)
vol_rank = vol.rank(axis=1, ascending=False)

def persistence(rank_table, h):
    rhos = np.array([stats.spearmanr(rank_table.iloc[i], rank_table.iloc[i + h]).statistic
                     for i in range(len(rank_table) - h)])
    return rhos.mean(), stats.ttest_1samp(rhos, 0.0)

for h in [1, 2, 4, 8]:
    print(h, persistence(ret_rank, h), persistence(vol_rank, h))

winner = ret_rank.idxmin(axis=1)
repeats = int((winner.values[:-1] == winner.values[1:]).sum())
print(repeats, len(winner) - 1, stats.binomtest(repeats, len(winner) - 1, 1 / 9).pvalue)
Full script with formatting and visualisation: sector-rank-persistence-python.py
Output
Select Sector SPDRs, quarterly total returns, 1999Q1 to 2024Q4
Funds: 9   quarters: 104   daily rows: 58,869
Sessions per quarter: min 59, median 63, max 64
Every fund priced on every session: True   dates ordered: True
Implied distribution per fund-year: median 1.85 points, max 6.46, none below -0.05 across 234 fund-years: True
Largest quarterly move: +39.0% / -50.4%

How much of the sector ordering survives? Mean Spearman rank correlation
between quarter t and quarter t+h, one correlation per pair of quarters.

Ranked on               Horizon   Pairs   Mean rho            95% CI       t           p
----------------------------------------------------------------------------------------
Quarterly return             1Q     103     -0.007  -0.090 to +0.076   -0.16       0.876
Quarterly return             2Q     102     +0.004  -0.072 to +0.081   +0.11       0.910
Quarterly return             4Q     100     -0.060  -0.144 to +0.024   -1.39       0.166
Quarterly return             8Q      96     +0.016  -0.066 to +0.099   +0.39       0.697

Realised volatility          1Q     103     +0.766  +0.730 to +0.802  +41.58     8.9e-66
Realised volatility          2Q     102     +0.699  +0.655 to +0.742  +31.55     4.1e-54
Realised volatility          4Q     100     +0.639  +0.587 to +0.692  +23.88     7.2e-43
Realised volatility          8Q      96     +0.577  +0.515 to +0.638  +18.42     4.0e-33

The same measurement on returns ranked at other frequencies
Ranked on                        Pairs   Mean rho       t         p
-------------------------------------------------------------------
Monthly rank, 1 month on           311     -0.018   -0.74     0.458
Monthly rank, 12 months on         300     -0.023   -0.98     0.330
Annual rank, 1 year on              25     -0.070   -0.83     0.416

Does the extreme sector repeat? Chance alone gives 11.1% for 9 funds.
Event                                      Repeats     Rate         p
---------------------------------------------------------------------
Best-returning sector repeats next quarter 11 of 103    10.7%    1.0000
Worst-returning sector repeats           17 of 103    16.5%    0.0848
Most volatile sector repeats             68 of 103    66.0%    0.0000
Least volatile sector repeats            63 of 103    61.2%    0.0000

Next quarter's return, by this quarter's rank
Rank this quarter     Mean next Q    Median  Positive
-----------------------------------------------------
1 (best)                   +1.70%    +2.10%       60%
2                          +2.47%    +3.44%       63%
3                          +2.62%    +4.10%       66%
4                          +2.96%    +3.33%       68%
5                          +2.50%    +3.45%       63%
6                          +2.17%    +3.07%       67%
7                          +1.40%    +1.76%       60%
8                          +3.82%    +4.42%       70%
9 (worst)                  +2.22%    +2.69%       67%
All sectors                +2.43%
Last quarter's winner against the all-sector average: -0.73 points, t = -1.01, p = 0.317

Sector record over the window
Sector                Ticker  Mean ret rank  Q at #1  Q at #9  Mean vol rank
----------------------------------------------------------------------------
Technology               XLK           4.58       20       13           3.62
Cons Discretionary       XLY           4.70        8        7           4.81
Materials                XLB           4.81       11       12           3.62
Industrials              XLI           4.81        3        2           5.41
Energy                   XLE           4.99       22       19           2.46
Health Care              XLV           4.99       12        6           6.80
Financials               XLF           5.07        9       13           3.55
Utilities                XLU           5.38       14       24           6.18
Cons Staples             XLP           5.67        5        8           8.55

Best minus worst sector, per quarter: mean 19.0 points, median 16.4, smallest 6.9, largest 54.3
What this tells us
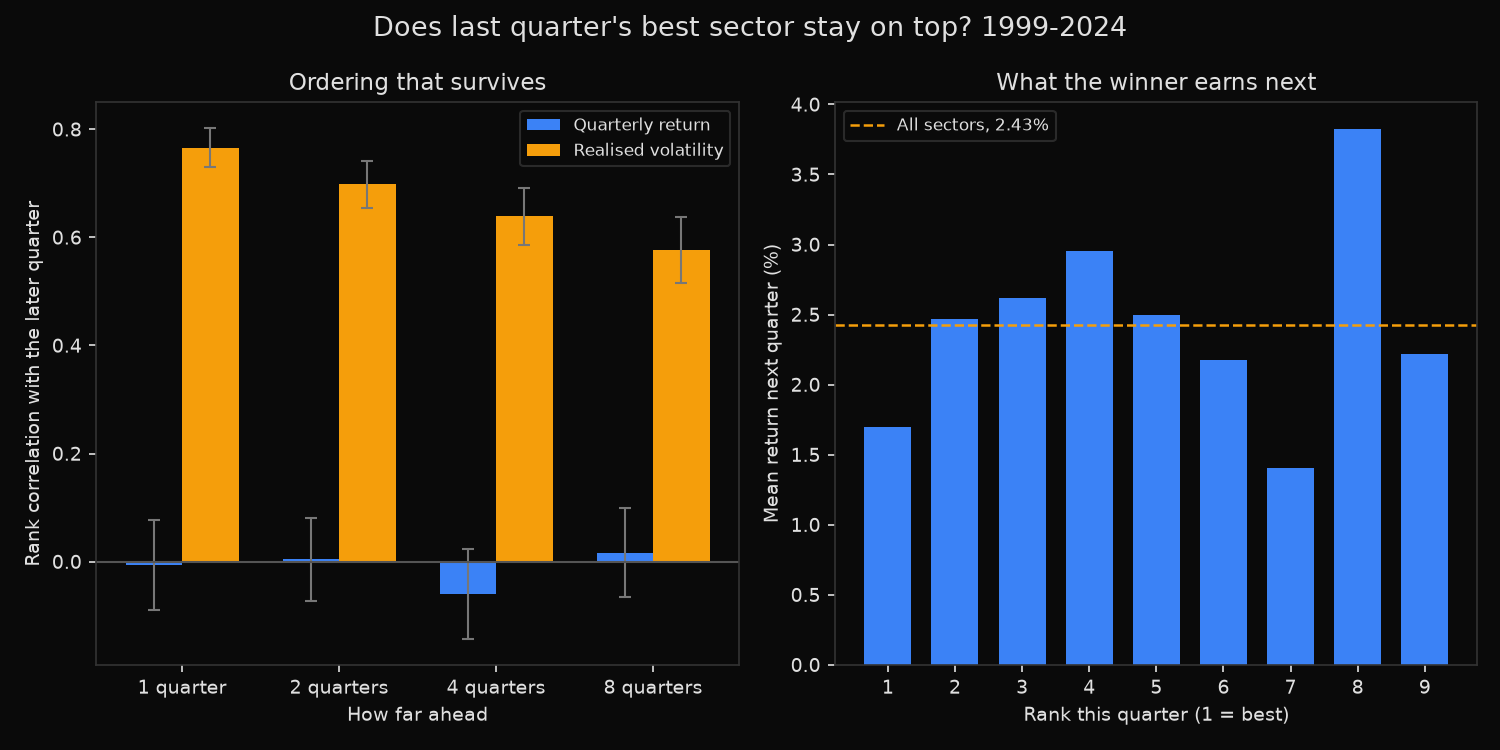
The return ordering does not survive a single quarter. Mean rank correlation is -0.007 at one quarter with a confidence interval of -0.090 to +0.076, so the data cannot distinguish the sector ordering from a fresh shuffle. Two, four and eight quarters out read the same way, with p-values of 0.910, 0.166 and 0.697, and changing the unit of time does not rescue it: monthly ranks one month ahead give -0.018, annual ranks one year ahead -0.070. The best sector of one quarter led again in the next 11 times out of 103, a rate of 10.7% against the 11.1% that random ordering delivers.
Volatility behaves completely differently, and that contrast is why it was included. Ranked on realised volatility the correlation is +0.766 one quarter ahead, with a t-statistic of 41.6, and it is still +0.577 two full years later. Same funds, same statistic, opposite result. Energy holds an average volatility rank of 2.46 and Consumer Staples 8.55, positions that barely move across 26 years.
Return ranks have no such anchor. Technology averages 4.58 and Consumer Staples 5.67, a spread of about one place across nine funds and 104 quarters. Energy finished first 22 times, more than any other fund, and last 19 times, second only to Utilities; leading more often than anyone else while trailing almost as often is what a high-variance series looks like once it is ranked.
Nothing exploitable hides under the flat correlation. Last quarter’s winner earned 1.70% in the following quarter against 2.43% for the average sector, a shortfall of 0.73 points with a p-value of 0.317. The +3.82% at rank 8 has no companion pattern in the ranks either side of it.
So what?
Drop trailing sector performance from the selection rule. It is not a weak signal needing better filtering or a longer lookback; across four horizons and three frequencies the measured persistence is zero, and acting on it buys turnover and tax rather than return. A sector view has to come from somewhere else: earnings revisions, rate sensitivity, commodity prices.
The volatility result is the one to build on. Risk ordering persists at +0.766 one quarter out and +0.577 eight quarters out, so last quarter’s realised volatility is a serviceable forecast of next quarter’s. Sizing sector positions by inverse volatility, or setting a risk budget per sector, uses the quantity the data says is predictable rather than the one it says is not.
Keep the 19-point average dispersion in view when sizing the bet. A big payoff with no free signal argues for holding the sector mix near the benchmark unless a specific thesis justifies the deviation.
Built with xfinlink — free financial data API for Python. pip install -U xfinlink
pip install -U xfinlink