Can Risk Parity Reduce Mega-Cap Drawdowns? Portfolio Optimization in Python
June 15, 2026
What's the question?
Mega-cap stocks are often treated as a diversified basket because they span technology, platforms, banks, energy, healthcare, and consumer staples. The problem is that equal-weighting a basket does not equalize risk. A highly volatile stock can dominate portfolio movement even if it has the same dollar weight as a defensive stock.
Risk parity is a portfolio construction method that allocates less capital to more volatile assets and more capital to less volatile assets. The simple version used here is inverse-volatility weighting: each stock receives a weight proportional to one divided by its recent volatility.
The practical question is whether this reduces drawdowns. A drawdown is the loss from a portfolio peak to its subsequent trough. Lower drawdowns matter because they reduce forced selling risk and make a strategy easier to hold through stress.
The approach
The universe is AAPL, MSFT, NVDA, AMZN, META, GOOG, JPM, XOM, JNJ, and PG. Built from SEC EDGAR public filings and market data, the test uses daily split-adjusted prices over the last three years.
- Pull daily adjusted closing prices for the 10 stocks
- Calculate daily returns
- Estimate each stock's annualized volatility using a 63-trading-day lookback
- Build daily inverse-volatility weights using only prior-day volatility
- Compare the inverse-volatility portfolio with a simple equal-weight portfolio
The one-day shift is important. It prevents the portfolio from using the same day's return to set the same day's weight.
Code
import xfinlink as xfl
import pandas as pd
import numpy as np

xfl.set_api_key("YOUR_API_KEY")  # free at https://xfinlink.com/signup

tickers = ["AAPL", "MSFT", "NVDA", "AMZN", "META", "GOOG", "JPM", "XOM", "JNJ", "PG"]
prices = xfl.prices(tickers, period="3y", fields=["adj_close"])
pivot = prices.pivot_table(index="date", columns="ticker", values="adj_close").dropna()
returns = pivot.pct_change().dropna()

vol = returns.rolling(63).std() * np.sqrt(252)
weights = (1 / vol.shift(1)).div((1 / vol.shift(1)).sum(axis=1), axis=0).dropna()

risk_parity = (returns.loc[weights.index] * weights).sum(axis=1)
equal_weight = returns.loc[weights.index].mean(axis=1)

def max_drawdown(r):
    wealth = (1 + r).cumprod()
    return (wealth / wealth.cummax() - 1).min()

print(risk_parity.mean() * 252, risk_parity.std() * np.sqrt(252), max_drawdown(risk_parity))
print(equal_weight.mean() * 252, equal_weight.std() * np.sqrt(252), max_drawdown(equal_weight))
Full script with formatting and visualisation: risk-parity-mega-cap-drawdown-python.py
Output
=== Mega-Cap Risk-Parity Drawdown Test ===
Universe: 10 mega-cap stocks
Sample: 2023-09-19 to 2026-06-12 (686 trading days)
Volatility lookback: 63 trading days
Portfolio comparison:
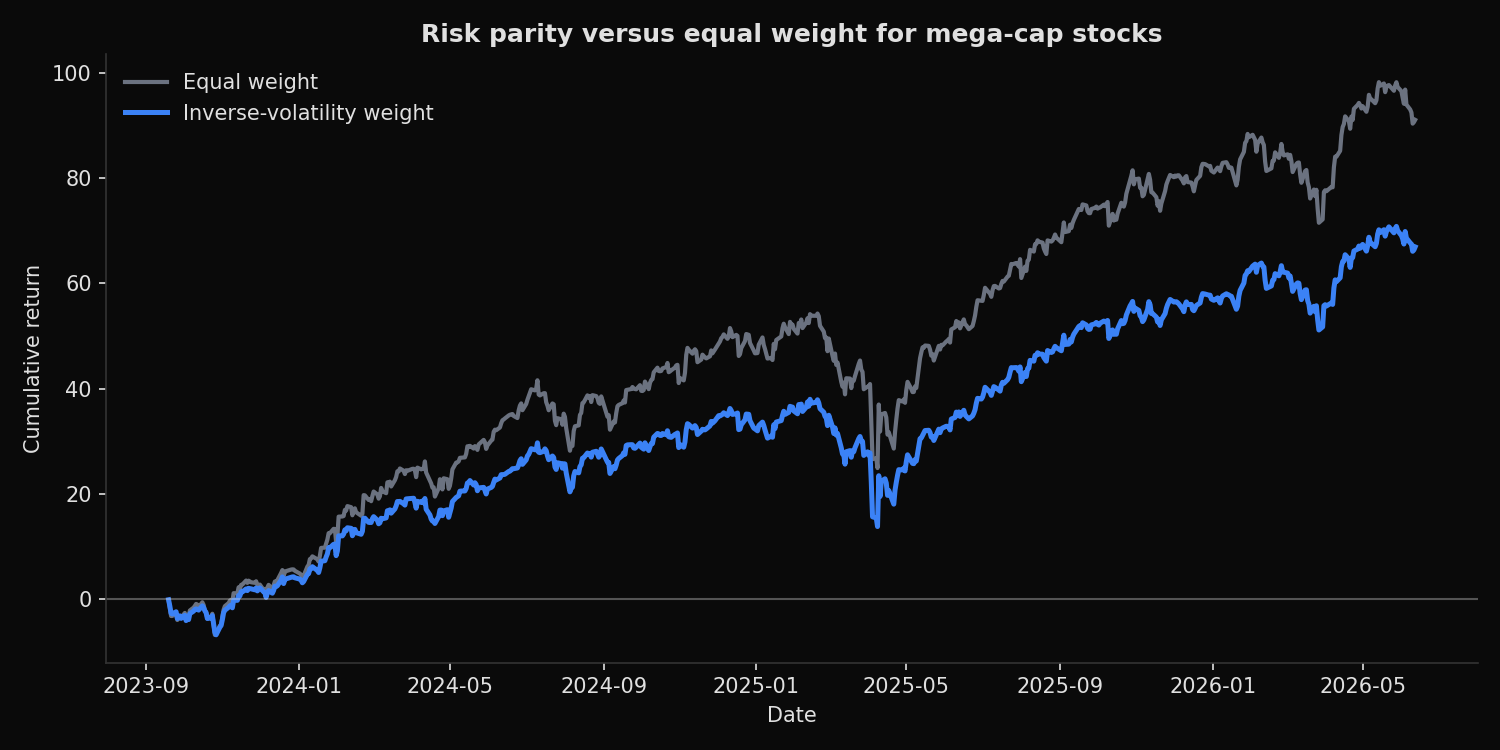
Equal weight return= 26.9% vol= 15.8% max_drawdown= -19.1% Sharpe= 1.70
Inverse-vol weight return= 20.7% vol= 13.5% max_drawdown= -17.6% Sharpe= 1.53
Latest inverse-volatility weights:
JNJ 15.2%
JPM 12.7%
PG 12.5%
AAPL 11.8%
AMZN 9.1%
XOM 9.0%
MSFT 8.7%
GOOG 7.7%
NVDA 6.8%
META 6.5%What this tells us
Inverse-volatility weighting did reduce risk. Annualized volatility fell from 15.8% to 13.5%, and maximum drawdown improved from -19.1% to -17.6%. The latest weights show why: JNJ, JPM, PG, and AAPL receive the highest allocations, while NVDA and META receive the lowest allocations because their recent volatility is higher.
The tradeoff is clear. The equal-weight portfolio earned a 26.9% annualized return, while the inverse-volatility portfolio earned 20.7%. The lower-risk portfolio also had a lower Sharpe ratio, 1.53 versus 1.70. In this sample, reducing exposure to volatile winners reduced both drawdown and upside.
The result is not a failure of risk parity. It is the expected behavior of a risk-control method during a period when high-volatility mega-cap stocks were strongly rewarded.
So what?
Risk parity is useful when the objective is smoother exposure, not maximum return. It can reduce single-stock dominance and make a concentrated equity basket less dependent on the most volatile names. That is valuable for risk budgeting, client portfolios, and mandates with drawdown limits.
The practical rule is to measure the cost of risk reduction. If inverse-volatility weighting lowers drawdown only slightly while giving up substantial return, equal weight may be the better choice. If drawdown reduction is the primary constraint, the lower return may be acceptable. The method turns that tradeoff into numbers instead of preference.
Built with xfinlink — free financial data API for Python. pip install -U xfinlink
pip install -U xfinlink