
Do Faster Inventory Turns Mean Thinner Margins? Gross Margin Return on Inventory in Python
July 31, 2026
What's the question?
There are two ways to make money from a warehouse. Sell each item at a wide markup and accept that it sits for months, or take a narrow markup and move the stock quickly. Both models survive.
Retail buyers formalise that tradeoff with gross margin return on inventory, usually shortened to GMROI: gross profit divided by the inventory carried to produce it. A GMROI of 3 means every dollar tied up in stock threw off three dollars of gross profit. It decomposes into gross margin and inventory turnover, the latter being cost of revenue divided by inventory.
The question is whether the two parts cancel. Competition says they should: if rapid turnover were free money, capital would move into the fast businesses until their margins fell far enough to equalise the return on stock. Exact cancellation would leave GMROI constant across companies and velocity worth nothing. Partial cancellation would mean the fast businesses keep something real, more gross profit from the same dollar of working capital.
The approach
The test measures both components for one fiscal year and asks how completely one offsets the other across the index.
- Universe: companies in the S&P 500 today. Financials, utilities and real estate drop out, since their balance sheets carry no product inventory cycle.
- Filings: the latest annual report per company with a fiscal year ending on or after 1 June 2025, so January and May year ends sit alongside December filers.
- Cross-check: the reported gross profit line and revenue minus cost of revenue must agree within 2 percent of revenue. Revenue stated gross of excise taxes against a cost line stated net of them, which is how tobacco companies report, inflates the margin, and companies where the two disagree drop from the sample.
- Inventory floor: inventory of at least 2 percent of revenue, about a week of sales, so the ratios describe a real stock cycle rather than a rounding item.
That leaves 206 companies. Fitting the relationship in logs makes the slope an elasticity: -1 means margin falls in exact proportion to the rise in turnover and GMROI is constant, while anything shallower means velocity pays.
Code
import numpy as np
import pandas as pd
import xfinlink as xfl
from scipy import stats

xfl.set_api_key("YOUR_API_KEY")  # free at https://xfinlink.com/signup

FIELDS = ["revenue", "cost_of_revenue", "gross_profit", "inventory"]

uni = xfl.index("sp500")
tickers = sorted(uni.loc[uni["removed_date"].isna(), "ticker"].dropna().unique())

f = xfl.fundamentals(tickers, period_type="annual", start="2025-06-01",
                     version="restated", fields=FIELDS)
latest = f.sort_values("period_end").groupby("ticker").tail(1)

s = latest[~latest["gics_sector"].isin({"Financials", "Utilities", "Real Estate"})]
s = s.dropna(subset=FIELDS)
s = s[(s[FIELDS] > 0).all(axis=1)].copy()
s["gross_profit_calc"] = s["revenue"] - s["cost_of_revenue"]
gap = (s["gross_profit"] - s["gross_profit_calc"]).abs() / s["revenue"]
s = s[(gap <= 0.02) & (s["inventory"] >= 0.02 * s["revenue"])]

s["gross_margin"] = s["gross_profit_calc"] / s["revenue"]
s["turns"] = s["cost_of_revenue"] / s["inventory"]
s["days_inventory"] = 365 / s["turns"]
s["gmroi"] = s["gross_profit_calc"] / s["inventory"]

fit = stats.linregress(np.log(s["turns"]), np.log(s["gross_margin"]))
s["quintile"] = pd.qcut(s["turns"], 5, labels=["Q1 slowest", "Q2", "Q3", "Q4", "Q5 fastest"])

print(f"slope {fit.slope:+.3f}  R2 {fit.rvalue ** 2:.3f}  p {fit.pvalue:.2g}")
print(s.groupby("quintile", observed=True)[["days_inventory", "gross_margin", "gmroi"]].median())
Full script with formatting and visualisation: inventory-turns-gross-margin-tradeoff-python.py
Output
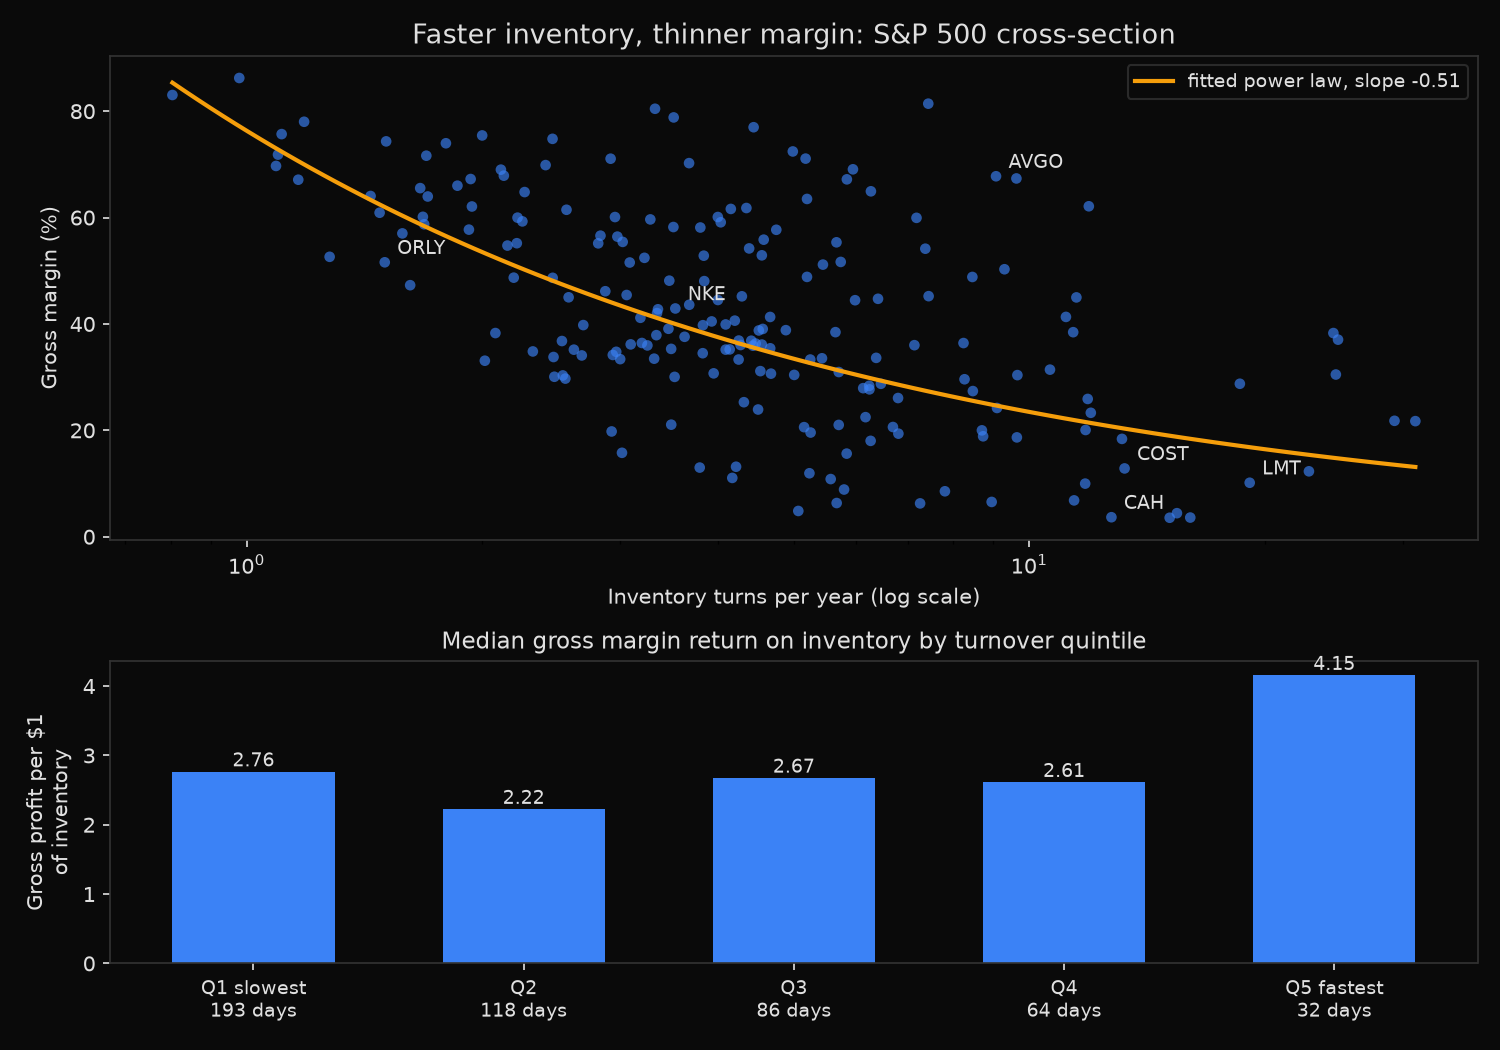
Sample: 206 current S&P 500 members, latest annual filing (2025-06-27 to 2026-05-31)

log gross margin on log turns: slope -0.512  R2 0.296  p 3.1e-17
Spearman turns vs gross margin: -0.545 (p 2.4e-17)
Spearman turns vs GMROI:        +0.139 (p 0.046)

Turnover quintile      n   days of inventory   gross margin   GMROI
Q1 slowest           42             193            63%     2.76
Q2                   41             118            41%     2.22
Q3                   41              86            39%     2.67
Q4                   41              64            31%     2.61
Q5 fastest           41              32            26%     4.15

Highest gross profit per dollar of inventory
  FFIV  F 5 INC                           49 days    81%   32.55
  KMI   KINDER MORGAN INC                 38 days    67%   19.87
  COP   CONOCOPHILLIPS                    31 days    62%   19.55
  AVGO  BROADCOM INC                      40 days    68%   19.07
  TRGP  TARGA RESOURCES CORP              15 days    38%   15.19
Lowest gross profit per dollar of inventory
  BG    BUNGE GLOBAL S A                  72 days     5%    0.26
  DOW   DOW INC                           64 days     6%    0.38
  CAH   CARDINAL HEALTH INC               29 days     4%    0.49
  ADM   ARCHER DANIELS MIDLAND CO         50 days     6%    0.49
  SMCI  SUPER MICRO COMPUTER INC          87 days    11%    0.52

Sector medians (sectors with at least 5 names)
  Materials                 26      67 days    28%    1.89
  Consumer Discretionary    25     103 days    37%    2.22
  Information Technology    40     109 days    48%    2.54
  Industrials               37      91 days    38%    2.67
  Consumer Staples          30      67 days    34%    2.93
  Health Care               39     123 days    64%    3.97
  Energy                     8      27 days    34%    9.33
What this tells us
The tradeoff is real. Rank correlation between turnover and gross margin is -0.545 across 206 companies, and the quintile medians fall from 63 percent at 193 days of inventory to 26 percent at 32 days. The slowest quintile carries six times the stock of the fastest and prices its goods at more than twice the markup.
The tradeoff is also incomplete. The fitted elasticity is -0.512, so doubling inventory turnover comes with a gross margin about 30 percent lower, not 50 percent lower. Full compensation requires -1. At roughly half that, faster companies retain part of the benefit of velocity: 4.15 dollars of gross profit per dollar of stock in the fastest quintile against 2.61 in the fourth.
The advantage is concentrated rather than gradual. Quintiles two through four cluster between 2.22 and 2.67, and the rank correlation between turnover and GMROI is only +0.139, marginal at p = 0.046. Turning stock faster does not order companies by return on inventory; it separates the extremes.
What drives GMROI is business model, not operating quality. The spread runs from 0.26 at Bunge, an agricultural processor whose 5 percent margin leaves almost nothing per dollar of grain in silos, to 32.55 at F5, which sells software-heavy networking gear at an 81 percent margin on seven weeks of hardware. Sector medians span 1.89 in materials to 9.33 in energy, where midstream operators hold under a month of stock.
So what?
Gross margin on its own does not travel between velocity regimes. Cardinal Health at 4 percent and Vertex Pharmaceuticals at 86 percent are not on the same scale, and a screen that ranks on margin alone ranks industries rather than companies. Dividing gross profit by inventory puts both on one axis; the benchmark that keeps the comparison honest is the sector median, not the market median.
The measure earns its keep inside a single company over time. A GMROI that falls while margin holds steady means stock is accumulating faster than sales, which is the standard prelude to a write-down. A GMROI that falls while turnover holds steady means the goods are moving only because they are being discounted. Both look identical in a headline revenue number.
For a working screen: rank on GMROI within sector, then split the year-on-year change into the margin term and the turnover term. The direction of the change matters more than the level, which the industry mostly sets.
Built with xfinlink — free financial data API for Python. pip install -U xfinlink
pip install -U xfinlink