
Split Adjustment Explained: Adjusted Close vs Close
July 30, 2026
Split adjustment restates a company’s older prices onto its current share basis, so the series does not jump on the day a split takes effect. The raw close is the price that printed on the tape. The split-adjusted close divides each earlier raw price by the cumulative factor of every split that came after it. Both columns describe the same investment, and they disagree about exactly one thing: the return measured across a split date, where the raw column is wrong by the full split ratio. Neither one contains dividends.
What does a split adjustment do to the numbers?
Chipotle ran a 50-for-1 split in June 2024. Holders of record on 18 June received 49 additional shares for each share held, distributed after the close on 25 June, and the stock began trading on a post-split basis at the open on 26 June. Nobody’s position changed value over that Tuesday night. The printed price fell by a factor of fifty.
import xfinlink as xfl

xfl.set_api_key("YOUR_API_KEY")  # free at https://xfinlink.com/signup

df = xfl.prices("CMG", start="2024-06-24", end="2024-06-27",
                fields=["close", "adj_close", "volume", "split_ratio", "return_daily"])
print(df.drop(columns=["entity_id", "entity_name", "gics_sector"]).to_string(index=False))
Output:
ticker       date      close  adj_close   volume  split_ratio  return_daily
   CMG 2024-06-24 3193.73999  63.874800   412931          NaN     -0.005217
   CMG 2024-06-25 3283.04004  65.660801   481061          NaN      0.027961
   CMG 2024-06-26   65.86000  65.860000 27266346         50.0      0.003034
   CMG 2024-06-27   62.41000  62.410000 28454247          NaN     -0.052384
Tuesday’s raw close of $3,283.04 becomes Wednesday’s $65.86. Differencing that column books a 97.99% single-day loss. The adj_close column has already divided the earlier prices by 50, and 3283.04 / 50 is 65.6608, which is the number the frame carries on the Tuesday row. Measured that way the Wednesday reads 65.6608 to 65.86, a gain of 0.30%, matching return_daily at 0.003034. The split_ratio column holds the 50 on the effective date, so a pipeline can identify the corporate action instead of inferring it from an implausible return.
Volume counts shares as they changed hands. 481,061 on the Tuesday and 27,266,346 on the Wednesday are quantities in different units, and a filter comparing today’s turnover against a twenty-day average will trip on the unit change alone. Dividing the earlier volumes by the same ratio puts both sides of the event on one basis.
Why does a reverse split break screens in the opposite direction?
Because it manufactures a gain rather than a loss, and a gain gets selected instead of caught.
Lucid Group consolidated its shares 1-for-10, effective at 5:00 p.m. Eastern on 29 August 2025, with split-adjusted trading from the market open on 2 September.
df = xfl.prices("LCID", start="2025-08-28", end="2025-09-03",
                fields=["close", "adj_close", "volume", "split_ratio", "return_daily"])
print(df.drop(columns=["entity_id", "entity_name", "gics_sector"]).to_string(index=False))
Output:
ticker       date  close  adj_close   volume  split_ratio  return_daily
  LCID 2025-08-28  2.070     20.700  8344920          NaN     -0.004808
  LCID 2025-08-29  1.980     19.800 12997360          NaN     -0.043478
  LCID 2025-09-02 17.660     17.660 21813800          0.1     -0.108081
  LCID 2025-09-03 16.785     16.785 23414200          NaN     -0.049547
Read the raw close and the stock went from $1.98 to $17.66, a gain of 791.92% in one session. What holders experienced was a fall of 10.81%. The adjustment runs the same division in the other direction because the ratio is 0.1 rather than 50: $1.98 divided by 0.1 restates the Friday at $19.80 on the consolidated basis.
Any screen that ranks names by trailing return will put a company like that at the head of its list, and the number looks nothing like a parsing error, which is how the mistake survives review. Companies reach for a reverse split when the price has fallen far enough to threaten a listing standard, so the fake winners a raw-price screen selects come from exactly the population it was meant to avoid.
Where do dividends fit into an adjusted price?
Nowhere, and that is deliberate. A split changes the units a holding is denominated in and nothing else, while a dividend takes cash out of the share price and puts it in the holder’s account. Folding the second into the price level makes every historical value a function of every dividend paid since, so a figure pulled last quarter stops matching the one pulled today. Split-only adjustment leaves the level alone on ex-dates.
Ignoring the cash is expensive over any long window.
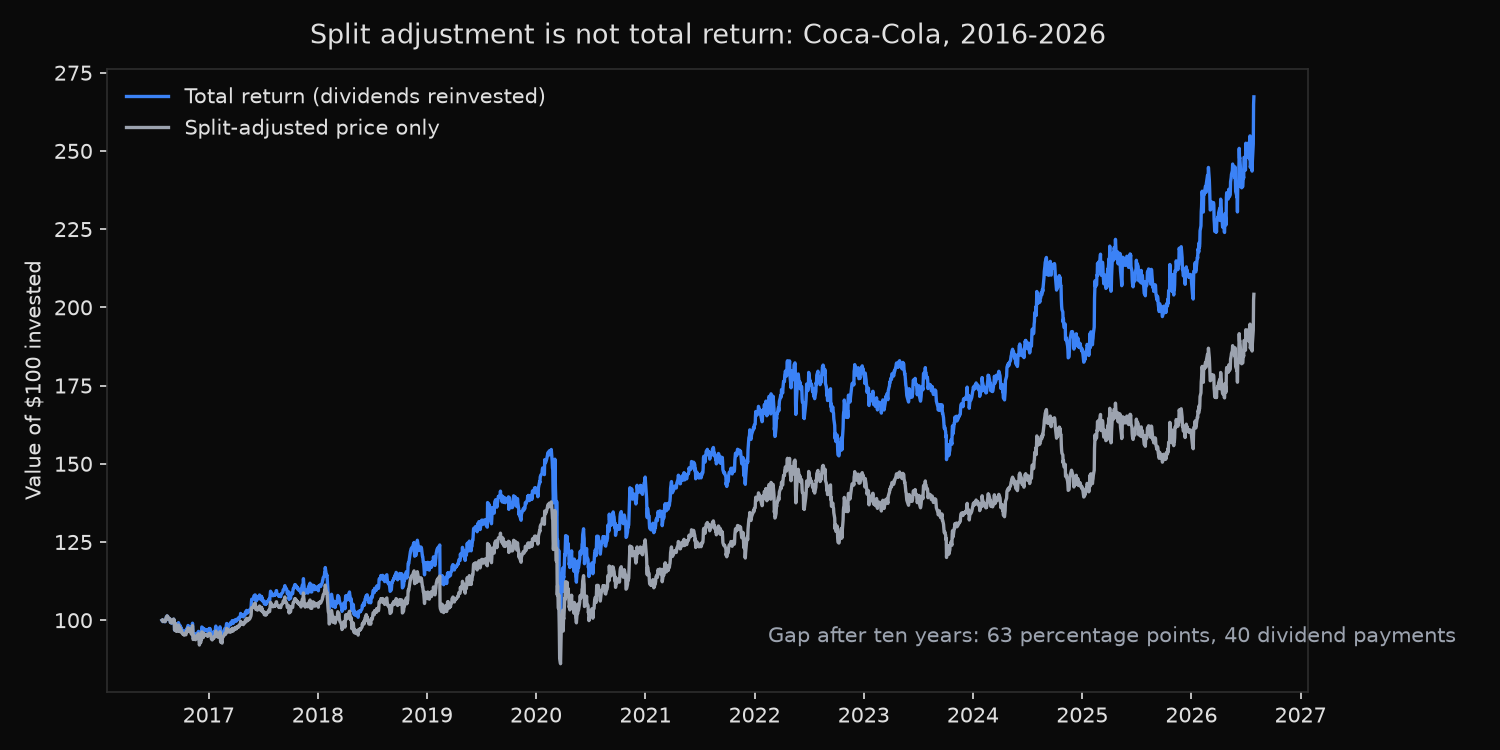
ko = xfl.prices("KO", start="2016-07-29", end="2026-07-29",
                fields=["adj_close", "return_daily", "dividend"]).sort_values("date")

price_return = ko["adj_close"].iloc[-1] / ko["adj_close"].iloc[0] - 1
total_return = (1 + ko["return_daily"].fillna(0)).prod() - 1
paid = ko["dividend"].dropna()

print(f"price return {price_return:+.2%}   total return {total_return:+.2%}")
print(f"{len(paid)} dividend payments, ${paid.sum():.2f} per share")
Output:
price return +104.17%   total return +167.28%
40 dividend payments, $17.30 per share
Sixty-three percentage points over 2,513 sessions, from a stock whose trailing yield is 2.3%. A test judged on adj_close alone understates an income or value strategy by roughly the yield every year, and the shortfall compounds. return_daily carries the total return directly, and the dividend column carries the cash on the row where it went ex, which is what makes the two figures above come from a single call. The wider set of columns a backtest needs is covered in the guide on data requirements for backtesting.
The free tier serves a rolling one-year window, so the ten-year pull above needs a paid key; daily prices reach 1996 on the $29 Pro plan.
Which price column should you actually read?
| What is needed | Column |
|---|---|
| The price that printed, for reconciling against a statement or a filing | close |
| A continuous series for charts, moving averages, volatility | adj_close |
| Daily performance including dividends | return_daily |
| The corporate action itself, on the date it happened | split_ratio, dividend |
Checked on 30 July 2026 against each project’s own documentation: yfinance takes an auto_adjust argument on download(), described as “Adjust all OHLC automatically” with a default of True, which is the kinder default for anyone who just wants a chart. Alpha Vantage splits the two apart, with TIME_SERIES_DAILY returning a “raw (as-traded) daily time series” while adjusted close values and the split and dividend events sit behind TIME_SERIES_DAILY_ADJUSTED, which its documentation labels “a premium API function”. Sources: the yfinance download reference and the Alpha Vantage documentation.
xfinlink returns the whole set on every row of one frame: close as traded, adj_close split-adjusted, split_ratio and dividend sitting on the event dates, return_daily for total return. The performance question and the reconciliation question get answered by the same call, with no second source to align and no adjustment convention to guess at. Field definitions are in the docs, and everything above was built from SEC EDGAR public filings and market data.
FAQ
Is adjusted close the same as total return?
No. Split-adjusted close removes the artificial steps a split leaves in the price series and stops there. Total return needs the dividends as well, which is what return_daily provides.
Why keep the raw close at all?
Because it is the only column that matches an outside record. A broker statement, a Form 4, an options chain and a filed per-share figure all refer to the price that traded, and a split-adjusted series will not tie to any of them.
How can a split-adjusted number be made reproducible years later?
Store the as-traded price together with the split factors that follow it. Backward adjustment is defined relative to the current share basis, so the durable representation is the raw price plus the events, and adjust="none" returns the frame without the adjusted column for exactly that purpose.
Do free data sources handle splits correctly?
Coverage of the mechanics varies more than the mechanics themselves. What separates sources in practice is whether the raw price, the adjusted price and the corporate action arrive together, which the guide on free stock market data APIs works through tier by tier.
Built with xfinlink — free financial data API for Python. pip install -U xfinlink
pip install -U xfinlink