
How Much of the S&P 500’s Margin Expansion Is Index Turnover? Shift-Share Decomposition in Python
September 15, 2026
What’s the question?
The S&P 500 keeps a far larger share of every sales dollar than it did ten years ago. The explanations usually involve software replacing labour, pricing power that outlasted the inflation shock, and a decade of cheap debt. All of them describe companies becoming more profitable.
A second mechanism has nothing to do with company performance. The index is a maintained list, and around twenty members are replaced each year. The replacements are not random: a company leaves after its market value collapses or it is acquired, and joins after several profitable years have made it large enough to qualify. An index that removes struggling businesses and admits successful ones reports a rising aggregate margin even if nothing inside it improves.
Both mechanisms produce the same headline number, so the headline number cannot separate them. A shift-share decomposition can. It splits the change in an aggregate into a within component, produced by the units inside it changing, and a composition component, produced by the mix changing. Aggregate net margin here is the sum of member net income divided by the sum of member revenue, which is how index margins are quoted.
The approach
- Take the point-in-time S&P 500 roster at each year end from 2014 to 2025, carrying every member by its permanent entity id, so a reassigned ticker cannot substitute one business for another.
- Pull annual filings for the union of those twelve rosters, 720 distinct entities, keeping revenue and net income.
- Assign each report to a calendar year: a fiscal year ending in June or later belongs to that year, one ending January to May to the year before.
- Compute each year’s aggregate margin across that year’s roster members.
- Split each year’s change. The within component is the margin change of companies present in both this year’s roster and last year’s; the composition component is the remainder, contributed by additions and removals.
- Chain the within components to build the margin path the index would have shown had its membership never changed.
Two cross-checks run on the same panel: cumulative growth of index revenue and net income against chains that only compare a company with itself, and the decomposition repeated without Financials and Real Estate.
Code
import numpy as np
import pandas as pd
import xfinlink as xfl

xfl.set_api_key("YOUR_API_KEY")  # free at https://xfinlink.com/signup

YEARS = list(range(2014, 2026))
rosters = {y: set(xfl.index("sp500", as_of=f"{y}-12-31")["entity_id"]) for y in YEARS}
ids = sorted(set().union(*rosters.values()))

raw = pd.concat([xfl.fundamentals(entity_id=ids[i:i + 100], period_type="annual",
                                  start="2013-06-01", end="2026-06-30",
                                  fields=["revenue", "net_income"])
                 for i in range(0, len(ids), 100)], ignore_index=True)

df = raw.copy()
df["year"] = np.where(df["period_end"].dt.month >= 6,
                      df["period_end"].dt.year, df["period_end"].dt.year - 1)
df = df[df["year"].between(2014, 2025)].sort_values(["entity_id", "year", "period_end"])
df = df.drop_duplicates(["entity_id", "year"], keep="last")
df = df[df["revenue"].notna() & (df["revenue"] > 0) & df["net_income"].notna()]

rev = df.pivot(index="entity_id", columns="year", values="revenue")
inc = df.pivot(index="entity_id", columns="year", values="net_income")
memb = {y: sorted(i for i in rosters[y] if i in rev.index and not np.isnan(rev.at[i, y]))
        for y in YEARS}
lvl = {y: 100 * inc.loc[memb[y], y].sum() / rev.loc[memb[y], y].sum() for y in YEARS}

for y in YEARS[1:]:
    stay = [i for i in memb[y] if i in memb[y - 1]]
    within = 100 * (inc.loc[stay, y].sum() / rev.loc[stay, y].sum()
                    - inc.loc[stay, y - 1].sum() / rev.loc[stay, y - 1].sum())
    print(y, round(lvl[y] - lvl[y - 1], 2), round(within, 2),
          round(lvl[y] - lvl[y - 1] - within, 2))
Full script with formatting and visualisation: sp500-margin-expansion-index-turnover-python.py
Output
Full script with formatting and visualisation: [sp500-margin-expansion-index-turnover-python.py](https://github.com/xfinlink/xfinlink-examples/blob/main/scripts/fundamental-analysis/sp500-margin-expansion-index-turnover-python.py)
**Output**
What this tells us
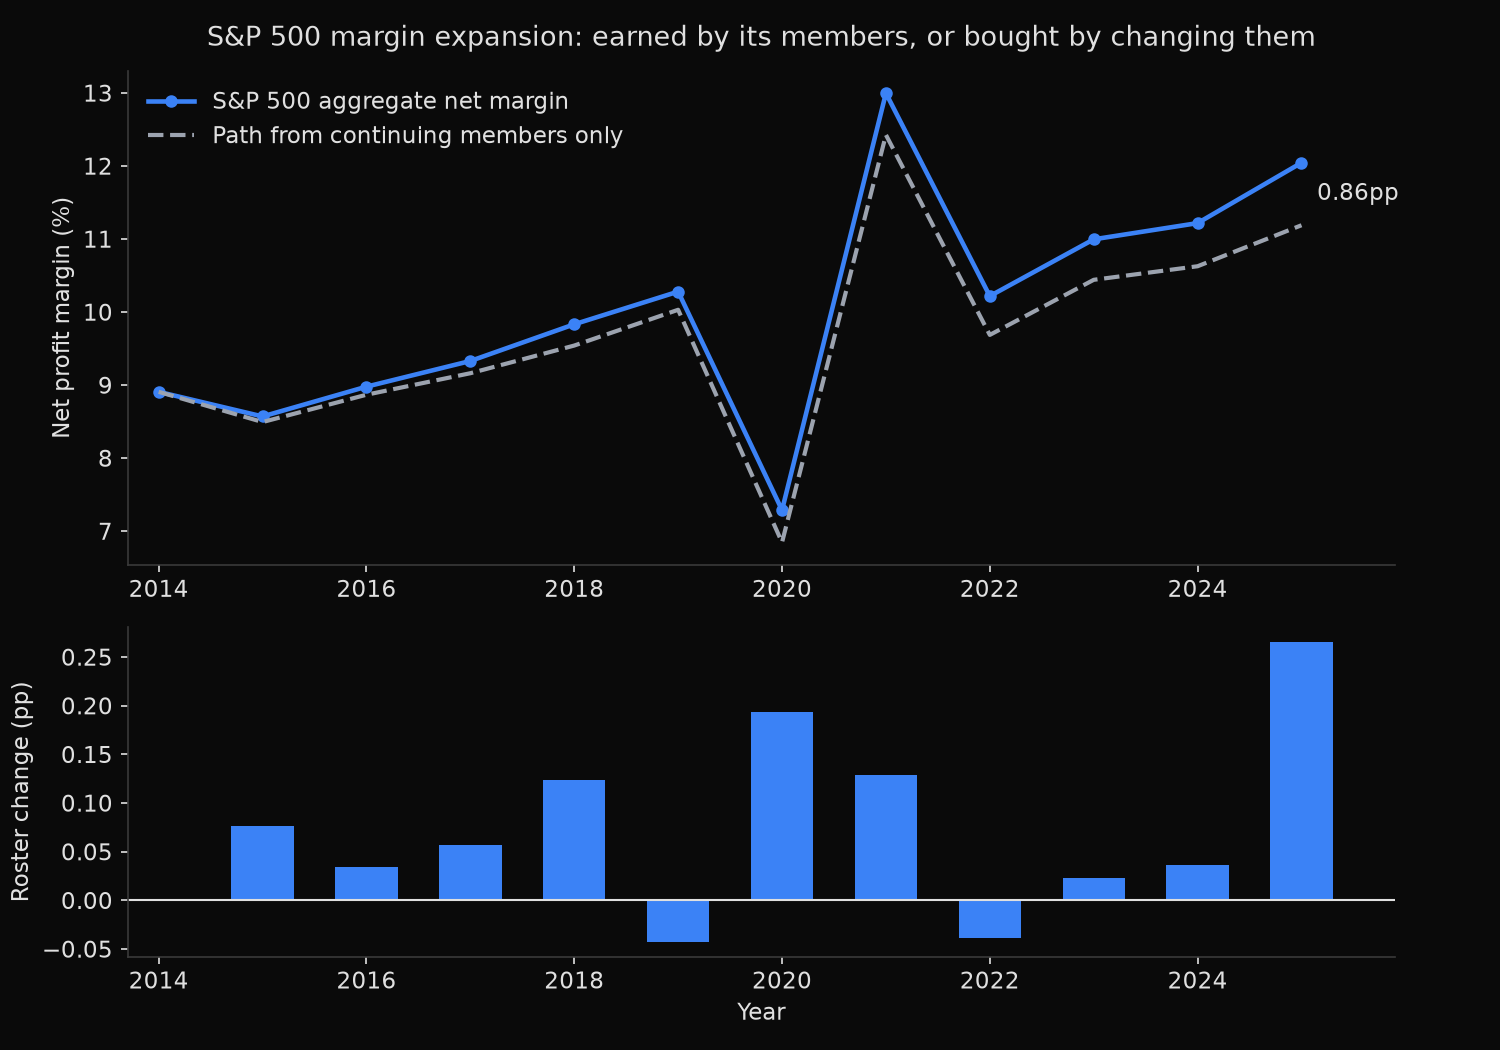
The aggregate margin rose from 8.91% in 2014 to 12.04% in 2025, a gain of 3.14 percentage points, of which continuing members produced 2.28 and roster change produced 0.86. The company-level mechanism is larger, but 27.3% of the expansion came from editing the list. That composition term is tiny in any single year and almost never negative: between plus 0.02 and plus 0.27 points across the nine positive years, and minus 0.04 in each of the two negative ones. Drift that small is invisible on an annual chart and hard to ignore once it compounds for a decade.
The entry and exit figures show the mechanism directly. The 222 company-years that entered the index carried an aggregate net margin of 9.84%; the 193 that left carried 4.03%. Mean revenue was almost identical on both sides, $8,977m entering against $9,141m leaving, so this is not large companies displacing small ones. It is profitable businesses displacing unprofitable ones at similar scale, which is what an index built on market value and an earnings requirement does by construction.
The growth chains say the same thing from the other side. Index revenue grew 69.7% over the eleven years against 70.4% for companies compared only with themselves, while index net income grew 129.5% against 111.2%. Roster change added almost nothing to sales and 18.3 points to profit.
Removing Financials and Real Estate does not weaken the result: on the remaining 566 entities the margin rose 2.67 points, of which roster change supplied 0.90, a larger share at 33.6%.
So what?
Index-level margin, and any multiple built on index-level earnings, measures two things at once. Treat a long-run change in either as evidence about corporate profitability only after removing the composition term, which takes one extra line: recompute the aggregate on the companies present in both periods and difference the two.
The consequence falls hardest on anyone forecasting index earnings. A model fitted to the reported aggregate has absorbed roughly 0.08 points of annual margin drift that no company generates and no management team can be asked about. Projecting it forward assumes the index keeps upgrading its roster at the same rate, which is an assumption about index maintenance rather than about business conditions.
The same correction applies to aggregate return on equity, aggregate leverage, or the share of index earnings coming from one sector. Each is a mix statistic. Before attributing a decade of movement to companies, hold the membership fixed and see how much survives.
Built with xfinlink — free financial data API for Python. pip install -U xfinlink
pip install -U xfinlink