
What's the question?
Semiconductor stocks now represent nearly 20% of the S&P 500. For much of 2024 and 2025, the rally was concentrated in two names: NVIDIA and Broadcom, both benefiting directly from AI accelerator demand. In mid-2026, a different pattern has emerged. Memory stocks like Micron jumped 4.5% in a single session in early July. Equipment makers AMAT, LRCX, and KLAC have posted strong multi-month runs. AMD has more than doubled over 60 trading days.
The question is whether the semiconductor rally is broadening — with gains spreading across the ecosystem — or whether the sector is merely rotating leadership from one narrow set to another. These are different conditions with different implications. A broad rally reflects sector-wide demand growth and is more likely to persist. A rotation from one concentrated leader to another signals stock-specific catalysts rather than fundamental breadth, and may not sustain.
Return dispersion provides a direct measurement. Cross-sectional dispersion is the standard deviation of returns across stocks on a given day. When dispersion is low, stocks move together — the rally is broad. When dispersion is high, individual stocks diverge sharply — leadership is narrow, even if multiple names are rising. A complementary measure is breadth: how many of the 10 semiconductor stocks trade above their 60-day moving average.
The approach
- Pull one year of daily returns for 10 semiconductor stocks spanning AI chips (NVDA, AVGO), general-purpose logic (AMD, QCOM), memory (MU, MRVL), and equipment (AMAT, LRCX, KLAC, TXN)
- Compute rolling 60-day cross-sectional return dispersion — the average daily standard deviation across all 10 stocks over trailing 60 days
- Compute each stock’s rolling 60-day cumulative return to track momentum leadership
- Build a normalized price index from daily returns and count how many of the 10 stocks trade above their 60-day moving average
- Compare the latest breadth and dispersion readings against their historical averages
Code
import xfinlink as xfl
import pandas as pd
import numpy as np

xfl.set_api_key("YOUR_API_KEY")  # free at https://xfinlink.com/signup

tickers = ["NVDA", "MU", "AVGO", "AMD", "AMAT", "LRCX", "KLAC", "MRVL", "QCOM", "TXN"]
df = xfl.prices(tickers, period="1y", fields=["return_daily"])

ret = df.pivot_table(index="date", columns="ticker", values="return_daily")
ret = ret.sort_index().dropna()

# Cross-sectional dispersion: std of returns across stocks each day
daily_cross_std = ret.std(axis=1)
rolling_dispersion = daily_cross_std.rolling(60).mean()

# Rolling 60-day cumulative return
rolling_cum = ret.rolling(60).apply(lambda x: (1 + x).prod() - 1)

# Normalized price index from returns, then 60-day MA
price_idx = (1 + ret).cumprod() * 100
ma60 = price_idx.rolling(60).mean()
above_ma = (price_idx > ma60).sum(axis=1)

latest_disp = rolling_dispersion.dropna().iloc[-1]
avg_disp = rolling_dispersion.dropna().mean()
latest_above = price_idx.iloc[-1] > ma60.iloc[-1]

for t in sorted(tickers, key=lambda x: rolling_cum.iloc[-1][x], reverse=True):
    cum = rolling_cum.iloc[-1][t]
    pct = (price_idx.iloc[-1][t] / ma60.iloc[-1][t] - 1) * 100
    status = "ABOVE" if latest_above[t] else "BELOW"
    print(f"{t:<6} 60d={cum:+.1%}  MA_gap={pct:+.1f}%  {status}")

print(f"\nBreadth: {int(above_ma.iloc[-1])}/{len(tickers)}")
print(f"Dispersion: {latest_disp:.4f} (avg {avg_disp:.4f})")
Full script with formatting and visualisation: semiconductor-breadth-dispersion-python.py
Output
Observation period: 2025-07-10 to 2026-07-09
Trading days: 251

Ticker     60d Return    vs 60d MA     Status
--------------------------------------------
MU           +132.5%       +20.9%      ABOVE
AMD          +121.5%       +22.5%      ABOVE
MRVL          +85.3%       +12.5%      ABOVE
AMAT          +48.8%       +21.0%      ABOVE
QCOM          +45.6%        -1.8%      BELOW
TXN           +42.4%        +6.7%      ABOVE
LRCX          +32.1%       +11.5%      ABOVE
KLAC          +29.8%       +11.0%      ABOVE
NVDA           +7.1%        -2.6%      BELOW
AVGO           +5.6%        -1.3%      BELOW

Breadth: 7/10 stocks above 60-day MA
Historical average breadth: 7.6/10

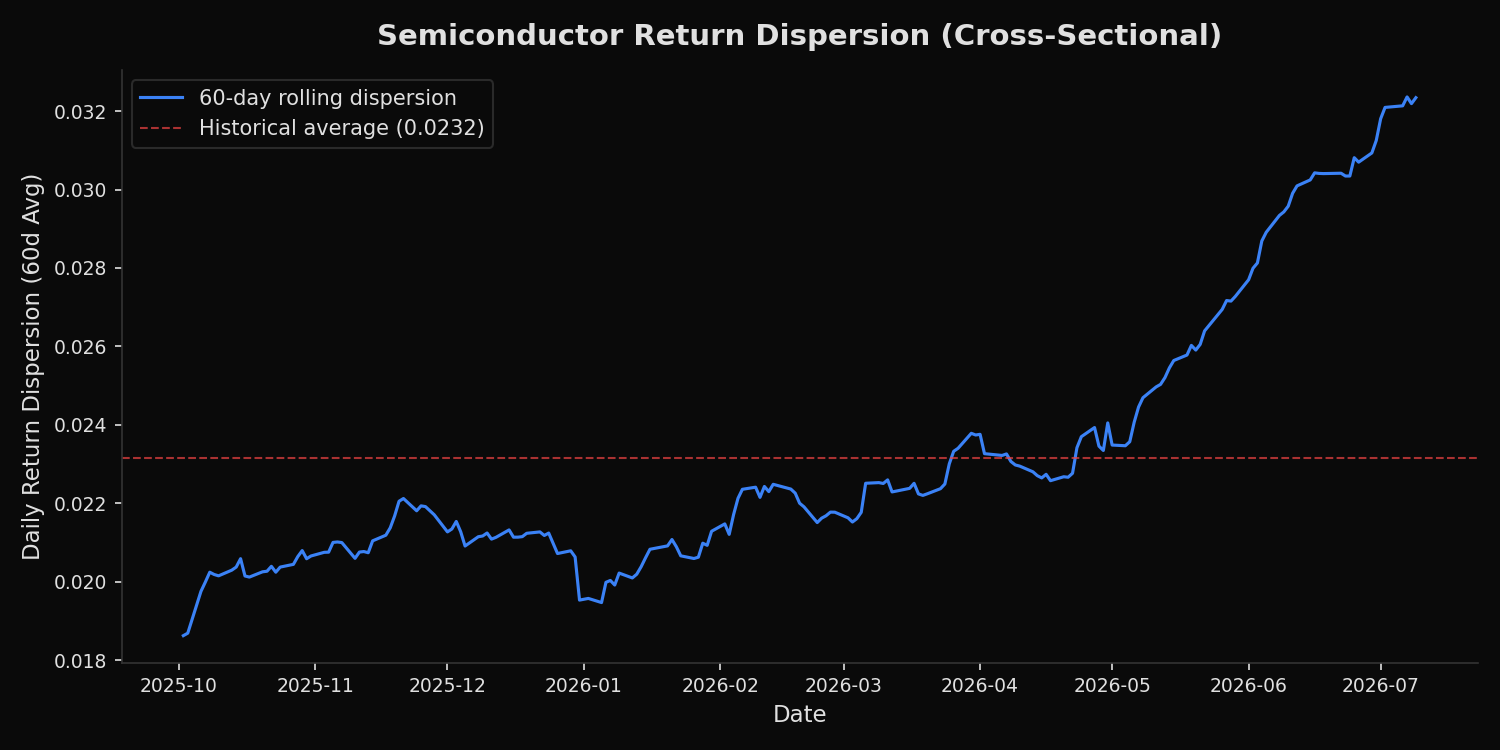
Return dispersion (60d rolling avg): 0.0323
Historical average dispersion:       0.0232
Current dispersion is 40% above average (leadership is narrow)
What this tells us
The breadth and dispersion readings tell two different stories, and the contradiction is informative.
Seven of ten stocks trade above their 60-day moving average. That figure is near the historical average of 7.6, suggesting broad participation. But return dispersion is 40% above its historical average and has been rising steeply since May 2026. The chart shows dispersion breaking away from its mean in April and accelerating through July.
The resolution lies in the magnitude differences. All ten stocks have positive 60-day cumulative returns, but the range spans from +5.6% (AVGO) to +132.5% (MU) — a 127-percentage-point spread. MU and AMD have each more than doubled in 60 trading days. NVDA and AVGO, the two stocks that led the semiconductor rally in 2024–2025, are the weakest performers in the group at +7.1% and +5.6% respectively. Both sit slightly below their 60-day moving averages.
This is not a broadening rally in the traditional sense. It is a rotation of leadership within semiconductors. Memory stocks (MU, MRVL) and equipment makers (AMAT, LRCX, KLAC) have replaced AI accelerator names as momentum leaders. The three stocks below their 60-day moving average — NVDA, AVGO, and QCOM — are the ones that led the prior cycle.
So what?
The distinction between broadening and rotation matters for positioning. A broadening rally supports sector-level bets (semiconductor ETFs, equal-weight baskets). A rotation favors stock selection and underweights prior leaders.
The current data supports the rotation interpretation. An equal-weight semiconductor basket would have gained roughly 55% over 60 days, but most of that return came from two stocks. Meanwhile, NVDA and AVGO — the largest weights in capitalization-weighted semiconductor indices — contributed the least. Anyone holding SMH (the VanEck Semiconductor ETF) at cap-weighted proportions captured a fraction of the sector’s best-performing names.
For portfolio construction, the dispersion reading of 0.0323 — 40% above average — signals that idiosyncratic risk within semiconductors is elevated. Pair trades within the sector (long laggards, short leaders) become more attractive when dispersion is high. Sector-level hedges become less effective because individual stock behavior dominates. Monitoring dispersion provides a real-time gauge of whether the sector is trading as a group or as a collection of individual stories.
Built with xfinlink — free financial data API for Python.