
Do One-Month Price Extremes Reverse? Signal Evaluation in Python
June 5, 2026
What's the question?
Mean reversion is the idea that an asset that moves too far in one direction tends to move back in the opposite direction. Many trading rules use this intuition. A stock that falls sharply is treated as oversold. A stock that rises sharply is treated as overbought.
The assumption can fail. A sharp decline can continue if fundamentals are deteriorating. A sharp rally can continue if earnings revisions or liquidity are improving. The practical question is whether one-month price extremes have recently produced reversal or continuation.
A reversal signal is useful only if future returns after loser extremes are higher than future returns after winner extremes. That difference is the reversal spread.
The approach
The test covers AAPL, MSFT, NVDA, AMZN, META, JPM, XOM, JNJ, PG, and SPY. The group mixes growth, defensive, financial, energy, and market exposure. Built from SEC EDGAR public filings and market data, the analysis uses three years of daily split-adjusted prices.
- Calculate each ticker's prior 21-day return
- Define loser extremes as the bottom 10% of prior 21-day returns for that ticker
- Define winner extremes as the top 10% of prior 21-day returns
- Measure the next 21-day return after each event
- Compare forward returns after loser and winner extremes
The thresholds are ticker-specific. This prevents a high-volatility stock from dominating the event set.
Code
import xfinlink as xfl
import pandas as pd

xfl.set_api_key("YOUR_API_KEY")  # free at https://xfinlink.com/signup

tickers = ["AAPL", "MSFT", "NVDA", "AMZN", "META", "JPM", "XOM", "JNJ", "PG", "SPY"]
df = xfl.prices(tickers, period="3y", fields=["adj_close"])
prices = df.pivot_table(index="date", columns="ticker", values="adj_close")[tickers].dropna()

lookback = prices.pct_change(21, fill_method=None)
forward = prices.shift(-21) / prices - 1

rows = []
for ticker in tickers:
    sample = pd.DataFrame({"lookback": lookback[ticker], "forward": forward[ticker]}).dropna()
    losers = sample[sample["lookback"] <= sample["lookback"].quantile(0.10)]
    winners = sample[sample["lookback"] >= sample["lookback"].quantile(0.90)]
    rows.append([ticker, losers["forward"].mean(), winners["forward"].mean()])

print(pd.DataFrame(rows, columns=["ticker", "after_losers", "after_winners"]))
Full script with formatting and visualisation: extreme-return-reversal-signal-python.py
Output
=== One-Month Extreme Return Reversal Test ===
Sample: 2023-06-06 to 2026-06-04 (752 price observations)
Signal definition: bottom and top 10% of prior 21-day returns
Forward horizon: 21 trading days
Average forward return after loser extremes: 2.6%
Average forward return after winner extremes: 2.2%
Average reversal spread: 0.5%
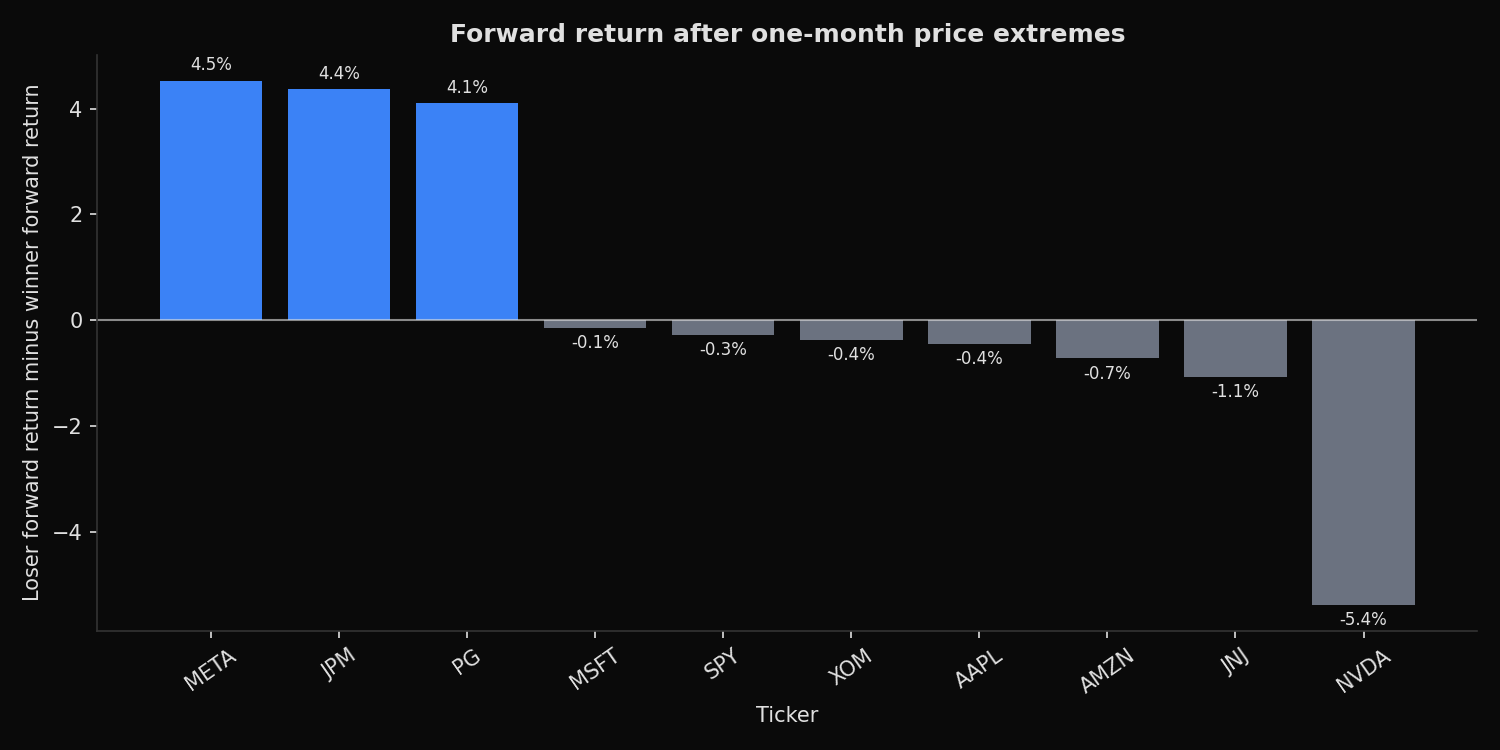
Strongest reversal ticker: META ( 4.5%)
Weakest reversal ticker: NVDA ( -5.4%)
Ticker-level signal results:
META loser_fwd= 6.1% winner_fwd= 1.6% spread= 4.5% events=71/71
JPM loser_fwd= 2.9% winner_fwd= -1.5% spread= 4.4% events=71/71
PG loser_fwd= 1.6% winner_fwd= -2.6% spread= 4.1% events=71/71
MSFT loser_fwd= 1.7% winner_fwd= 1.9% spread= -0.1% events=71/71
SPY loser_fwd= 3.0% winner_fwd= 3.3% spread= -0.3% events=71/71
XOM loser_fwd= 1.1% winner_fwd= 1.5% spread= -0.4% events=71/71
AAPL loser_fwd= 1.9% winner_fwd= 2.3% spread= -0.4% events=71/71
AMZN loser_fwd= 1.8% winner_fwd= 2.5% spread= -0.7% events=71/71
JNJ loser_fwd= 0.2% winner_fwd= 1.3% spread= -1.1% events=71/71
NVDA loser_fwd= 6.0% winner_fwd= 11.4% spread= -5.4% events=71/71What this tells us
The aggregate reversal effect is small. Average forward return after loser extremes is 2.6%, compared with 2.2% after winner extremes. The average reversal spread is only 0.5 percentage points.
The ticker-level results matter more than the average. META, JPM, and PG show meaningful reversal spreads of 4.5%, 4.4%, and 4.1%. NVDA shows the opposite pattern. After top-decile one-month rallies, NVDA's next 21-day return averages 11.4%. After bottom-decile moves, it averages 6.0%. That is momentum continuation, not mean reversion.
SPY is close to neutral, with a -0.3% spread. The broad market does not show enough reversal in this sample to justify a mechanical buy-the-dip rule.
So what?
One-month extremes should not be treated as a universal signal. A mean-reversion rule can make sense for some stocks, but it should be validated ticker by ticker. The same rule that looks sensible for META, JPM, and PG would have fought NVDA's trend.
For trading research, the reversal spread is the first filter. If the spread is positive and large enough to survive costs and slippage, the signal deserves further testing. If the spread is close to zero or negative, the better assumption is that price extremes contain information, not only temporary emotion.
Built with xfinlink — free financial data API for Python. pip install xfinlink
pip install xfinlink