
What's the question?
Consumer staples companies are often described as inflation hedges. The logic: people still buy toothpaste, cereal, and soft drinks regardless of price levels, so these firms can pass cost increases through to consumers. If that assumption holds, gross margins should remain stable even when input costs rise.
CPI has remained above 4% year-over-year through mid-2026, the highest sustained inflation since the early 2020s. At the same time, commodity prices for key inputs — cocoa, coffee, sugar, packaging materials — have moved sharply higher. PepsiCo recently reported US volume weakness, suggesting consumers are beginning to resist price increases.
The question is whether the “pricing power” narrative is actually holding in the data. If gross margins are compressing, it means companies are absorbing input cost increases rather than passing them through. If margins are stable, pricing power is intact. If they are expanding, companies have been raising prices faster than their costs are rising.
The approach
The analysis compares two periods for 10 consumer staples companies: a pre-inflation baseline (2019 through 2021) and the most recent four quarters of reported results.
- Pull quarterly fundamentals for PEP, KO, PG, CL, WMT, COST, MDLZ, GIS, KHC, and SJM covering the last 7 years
- Compute gross margin as (revenue minus cost of revenue) divided by revenue for each quarter
- Average gross margin over the 2019-2021 pre-inflation baseline (approximately 12 quarters per company)
- Average gross margin over the trailing four quarters
- Rank companies by margin change in percentage points
The ticker set spans beverage companies (PEP, KO), household products (PG, CL), grocery retailers (WMT, COST), and packaged food (MDLZ, GIS, KHC, SJM). This diversity exposes which categories have commodity exposure that overwhelms pricing power.
Code
import xfinlink as xfl
import pandas as pd

xfl.set_api_key("YOUR_API_KEY")  # free at https://xfinlink.com/signup

tickers = ["PEP", "KO", "PG", "CL", "WMT", "COST", "MDLZ", "GIS", "KHC", "SJM"]

df = xfl.fundamentals(
    tickers, period_type="quarterly", period="7y",
    fields=["revenue", "cost_of_revenue"]
)

df["gross_margin"] = (df["revenue"] - df["cost_of_revenue"]) / df["revenue"]

pre = df[(df["period_end"] >= "2019-01-01") & (df["period_end"] <= "2021-12-31")]
pre_avg = pre.groupby("ticker")["gross_margin"].mean()

latest = df.sort_values("period_end").groupby("ticker").tail(4)
lat_avg = latest.groupby("ticker")["gross_margin"].mean()

result = pd.DataFrame({
    "Pre-Inflation GM": pre_avg, "Latest GM": lat_avg
}).dropna()
result["Change (pp)"] = (result["Latest GM"] - result["Pre-Inflation GM"]) * 100
result = result.sort_values("Change (pp)")

for t, row in result.iterrows():
    print(f"{t:<6} {row['Pre-Inflation GM']*100:5.1f}% -> {row['Latest GM']*100:5.1f}%  "
          f"{row['Change (pp)']:+5.1f}pp")
Full script with formatting and visualisation: consumer-staples-margin-inflation-python.py
Output
Ticker  Pre GM  Lat GM  GM Chg  Pre OM  Lat OM  OM Chg
--------------------------------------------------------
MDLZ     39.4%   28.9%  -10.5pp   14.9%    9.4%   -5.5pp
SJM      38.5%   33.3%   -5.2pp   16.2%   10.1%   -6.1pp
GIS      34.9%   33.5%   -1.4pp   17.1%   15.5%   -1.6pp
COST     13.3%   12.9%   -0.4pp    3.4%    3.8%   +0.4pp
PEP      54.4%   54.2%   -0.2pp   14.5%   12.9%   -1.6pp
PG       50.4%   50.3%   -0.1pp   23.2%   23.2%   -0.0pp
WMT      24.3%   24.2%   -0.1pp    4.3%    4.2%   -0.1pp
CL       60.1%   60.1%   -0.0pp   21.6%   15.4%   -6.2pp
KHC      33.7%   33.9%   +0.2pp   11.5%   16.7%   +5.3pp
KO       61.1%   61.7%   +0.6pp   27.9%   29.2%   +1.3pp
What this tells us
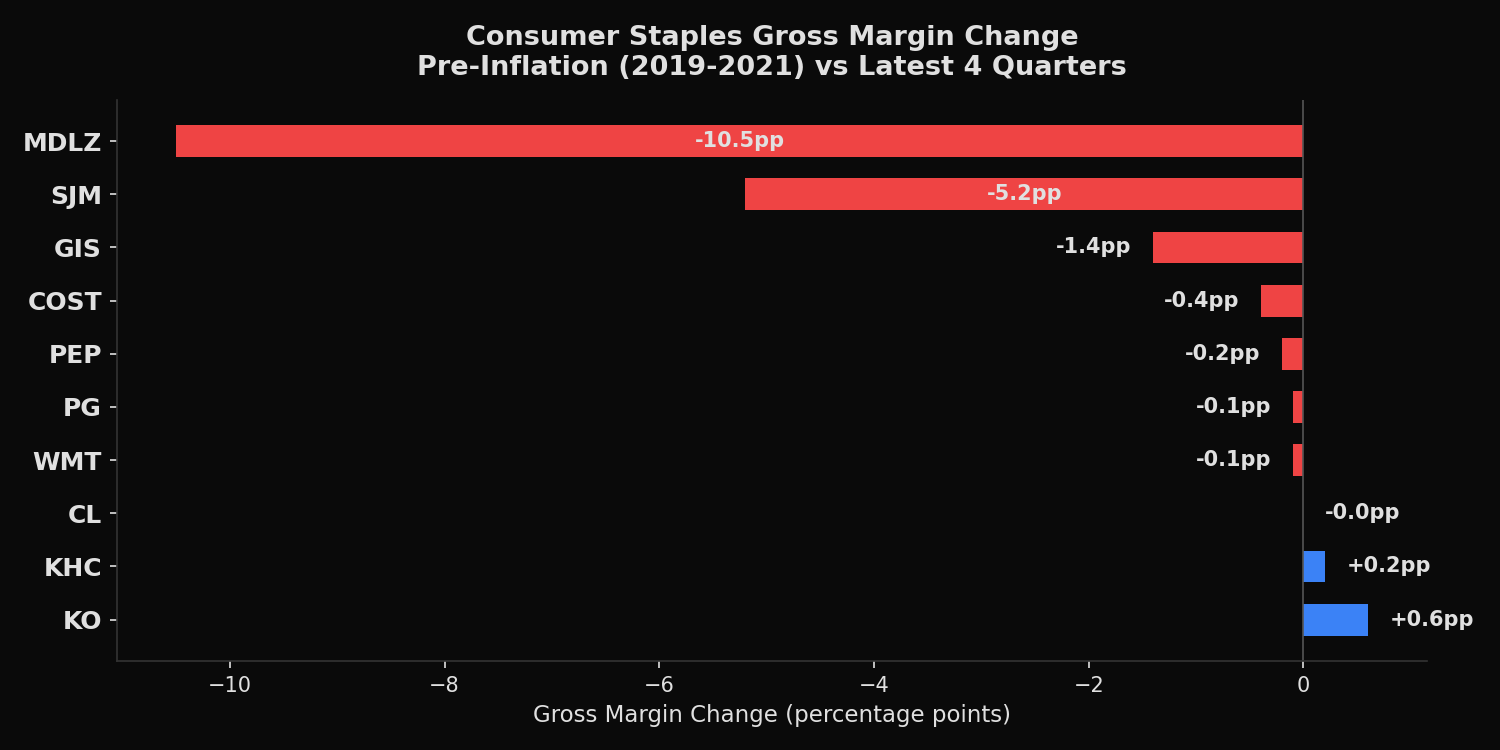
The sector is not experiencing uniform margin compression. Instead, the data reveals a clear split driven by commodity input exposure.
Mondelez (MDLZ) stands out with a 10.5 percentage point gross margin decline, falling from 39.4% to 28.9%. This is the cocoa effect. Cocoa futures roughly tripled between late 2023 and mid-2026, and Mondelez — whose portfolio includes Cadbury, Milka, and Toblerone — has the highest direct cocoa exposure among large-cap consumer staples. JM Smucker (SJM) lost 5.2 percentage points, reflecting elevated coffee bean prices that pressure its Folgers and Dunkin’ branded products.
General Mills (GIS) shows a modest 1.4 percentage point decline. Its commodity basket is more diversified — wheat, corn, sugar, dairy — which dilutes the impact of any single input price spike.
The remaining seven companies show gross margin changes within half a percentage point of zero. Coca-Cola (KO) actually expanded margins by 0.6 percentage points, reaching 61.7%. This reflects KO’s concentrate-based business model, where bottling partners absorb a significant share of input cost volatility. PG, CL, PEP, WMT, and COST all maintained margins within 0.2 percentage points of their pre-inflation levels, confirming that broad pricing power in household goods, beverages, and grocery retail has held.
Operating margins tell a somewhat different story. Colgate-Palmolive (CL) maintained its 60.1% gross margin perfectly but lost 6.2 percentage points of operating margin, suggesting that rising costs are appearing in SG&A (marketing, distribution, and labor) rather than in cost of goods sold.
So what?
The “consumer staples as inflation hedge” narrative is partially correct, but treating the sector as monolithic is a mistake. Of the 10 companies tested, only two — MDLZ and SJM — experienced gross margin compression exceeding 1 percentage point. Both have concentrated exposure to specific commodities (cocoa and coffee) that have experienced extreme price moves.
For portfolio construction, the data suggests differentiating between commodity-specific risk and broad inflation risk. A basket of PG, KO, CL, and WMT has delivered near-zero gross margin erosion through four years of elevated inflation. MDLZ and SJM, while still profitable, are absorbing costs that may take multiple quarters to recover through pricing.
The practical screen is straightforward: compute the trailing-4-quarter gross margin versus a pre-shock baseline. Companies with compression exceeding 2 percentage points warrant closer analysis of their input cost exposure before being treated as defensive holdings.
Built with xfinlink — free financial data API for Python.