
Do Steady Margins Mean Calmer Stocks? Cross-Sectional Analysis in Python
August 16, 2026
What’s the question?
Operating margin is the share of revenue a company keeps after the costs of running the business, before interest and taxes. A firm whose margin holds near the same level year after year is converting sales into profit through a stable process. A firm whose margin swings from 30 percent to 12 percent and back is exposed to something it does not control: commodity prices, a product cycle, a price war.
Stock volatility measures a different thing, the size of a share price’s daily moves. The two are often assumed to be linked. A business with predictable economics should, in theory, be a predictable stock. Whether that link actually holds in the data is worth checking, because it decides whether a fundamental characteristic that shows up in financial statements carries information about the risk an investor takes on.
The question here is direct: across large companies, does the year-to-year stability of operating margin line up with how volatile the stock has been?
The approach
The sample is 43 large non-financial companies with a full decade of annual filings and a continuous price history. Financial companies are excluded because operating margin does not mean the same thing for a bank or an insurer as it does for a manufacturer or a retailer, and mixing them would compare quantities that are not alike. Names without ten years of usable annual filings for the window drop from the sample.
- For each company, pull ten years of annual operating income and revenue (2015 to 2024) and compute operating margin for each year.
- Measure margin stability as the standard deviation of those ten annual margins, in percentage points. A low number means the margin barely moved; a high number means it swung.
- Separately, compute the annualised volatility of daily stock returns over 2015 to 2025.
- Rank the companies on both measures and compute the Spearman rank correlation, which captures whether the ordering agrees without assuming the relationship is a straight line. Then sort the companies into three equal groups by margin stability and compare the average stock volatility of each group.
Ranks are used rather than raw values because both measures have long right tails. A single company with an extreme margin swing should not dominate the result, and rank correlation is insensitive to that.
Code
import numpy as np
import pandas as pd
import xfinlink as xfl
from scipy import stats

xfl.set_api_key("YOUR_API_KEY")  # free at https://xfinlink.com/signup

universe = ["AAPL", "MSFT", "NVDA", "ORCL", "CSCO", "ADBE", "CRM", "TXN", "QCOM",
            "ACN", "GOOGL", "NFLX", "DIS", "CMCSA", "AMZN", "HD", "MCD", "NKE",
            "SBUX", "LOW", "TJX", "KO", "PEP", "PG", "WMT", "COST", "CL", "MDLZ",
            "JNJ", "UNH", "PFE", "MRK", "ABT", "TMO", "MDT", "AMGN", "HON", "UNP",
            "CAT", "DE", "LMT", "RTX", "UPS", "XOM", "CVX", "COP", "LIN", "SHW",
            "NEE", "DUK", "SO"]

f = xfl.fundamentals(universe, start="2015-01-01", end="2024-12-31",
                     period_type="annual", fields=["revenue", "operating_income"])
f["op_margin"] = 100 * f["operating_income"] / f["revenue"]

px = xfl.prices(universe, start="2015-01-01", end="2025-12-31",
                fields=["return_daily"], max_rows=400000)

rows = []
for t in universe:
    ft = f[f["ticker"] == t]
    pt = px[px["ticker"] == t]
    if ft["fiscal_year"].nunique() < 10 or pt["ticker"].nunique() != 1:
        continue
    rows.append((t, ft["op_margin"].std(ddof=1),
                 pt["return_daily"].std() * np.sqrt(252) * 100))

d = pd.DataFrame(rows, columns=["ticker", "margin_sd", "stock_vol"])
rho, p = stats.spearmanr(d["margin_sd"], d["stock_vol"])
print(f"rho = {rho:.3f}, p = {p:.4f}")
Full script with formatting and visualisation: operating-margin-stability-stock-volatility-python.py
Output
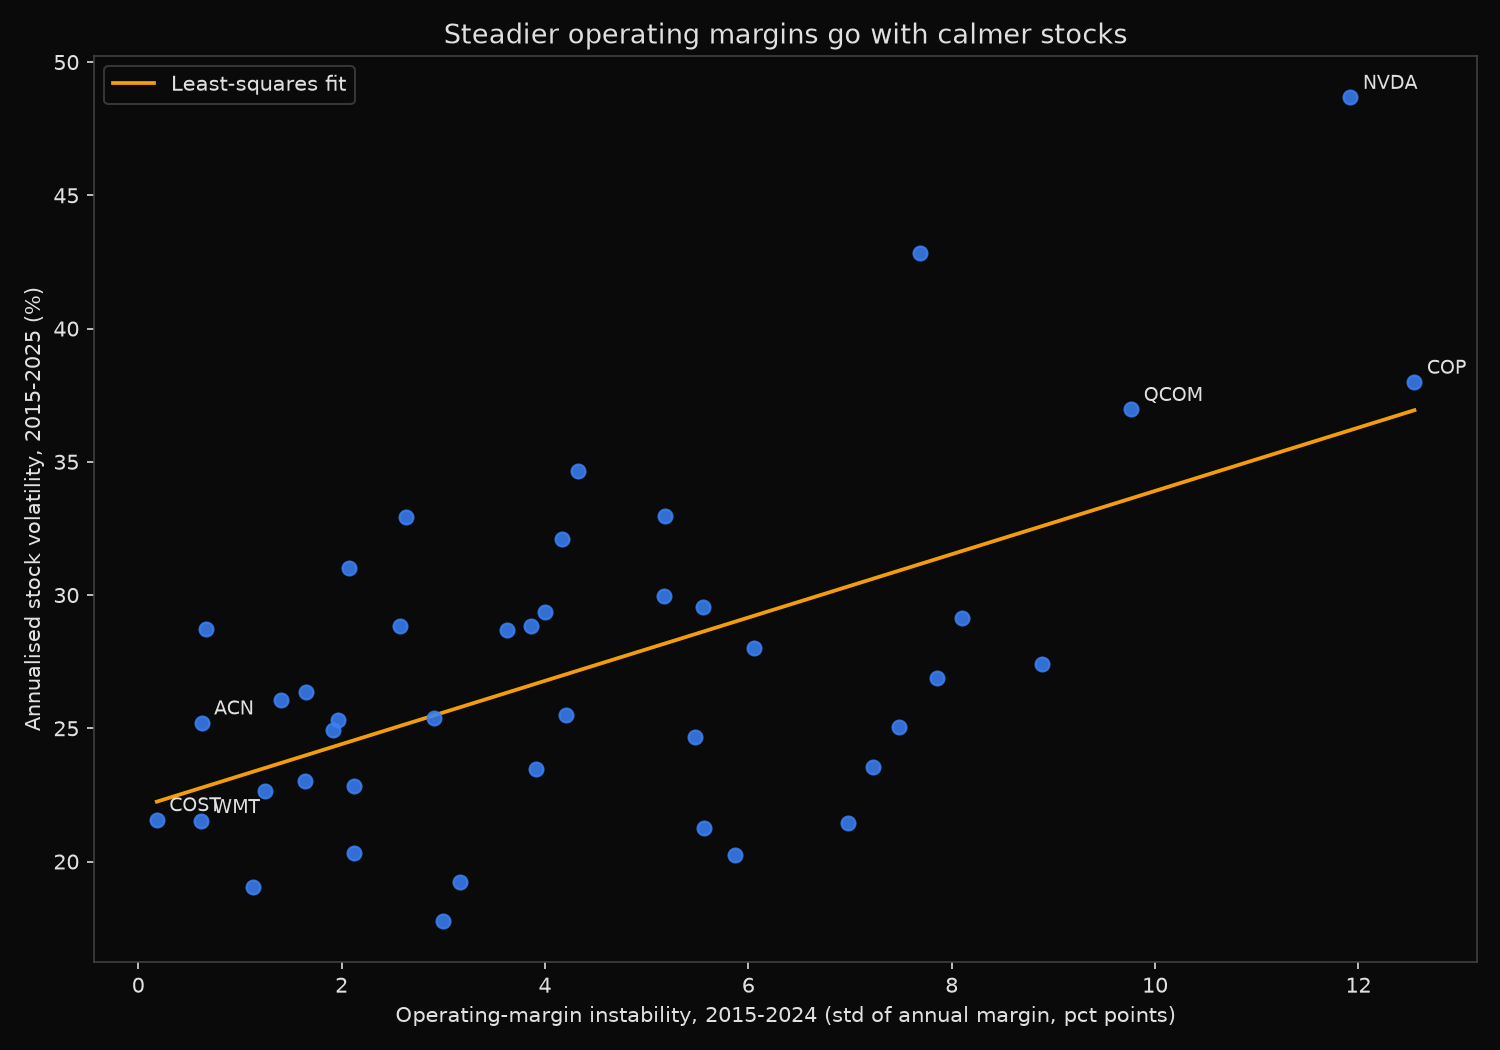
43 non-financial large caps with 10 annual margins and continuous prices
margin_sd = standard deviation of annual operating margin, 2015-2024 (pct points)
stock_vol = annualised volatility of daily returns, 2015-2025 (%)

Spearman rank correlation (margin instability vs stock volatility): rho = 0.415, p = 0.0057

average stock volatility by operating-margin-stability tercile
tercile          mean vol   median vol   n
steadiest           24.5%       24.9%   15
middle              27.5%       28.8%   14
most variable       29.9%       27.7%   14

five steadiest margins: COST, WMT, ACN, UNH, PEP
five most variable    : CVX, XOM, QCOM, NVDA, COP
What this tells us
The rank correlation is 0.415 with a p-value of 0.0057. Positive, moderate, and unlikely to be chance: companies with more variable operating margins have tended to have more volatile stocks. The relationship is real, but it is far from tight. A rank correlation of 0.42 leaves most of the variation in stock volatility unexplained by margin stability alone.
The tercile averages trace the same pattern more plainly. The steadiest third of companies by margin averaged 24.5 percent annualised volatility. The most variable third averaged 29.9 percent, roughly a fifth higher. The middle third sits between them at 27.5 percent. The ordering is monotone, which is what a genuine relationship looks like, though the median for the most variable group falls slightly below its mean, a sign that a few very high-volatility names are pulling that group’s average up.
The names at the extremes explain the mechanism. The steadiest margins belong to Costco, Walmart, Accenture, UnitedHealth, and PepsiCo, businesses that sell staples or services at consistent markups regardless of the economic weather. The most variable belong to Chevron, Exxon, Qualcomm, Nvidia, and ConocoPhillips. Three are energy producers whose margins rise and fall with the oil price, and two are semiconductor firms whose margins track a sharp product-and-demand cycle. In each case the same external force that whips the operating margin around also drives the stock, so the two move together.
So what?
Margin stability is a usable, if partial, signal for the risk in a stock. It comes from the income statement rather than the price series, so it carries information the price history does not, and it is available before a stock has a long trading record. For a screen, ranking a candidate list by the standard deviation of historical operating margin gives a fundamentals-based proxy for volatility that can be combined with price-based measures rather than duplicating them.
The limits matter as much as the signal. With a rank correlation of 0.42, margin stability cannot stand in for a proper volatility estimate, and a steady-margin company is not guaranteed to be a calm stock. The practical use is at the group level: a portfolio tilted toward businesses with stable margins will, on average, hold calmer stocks, and one built from cyclical-margin businesses should be expected to move more, with position sizing set accordingly. The signal is a tilt, not a rule.
Built with xfinlink — free financial data API for Python. pip install -U xfinlink
pip install -U xfinlink