
How Much Does the Dow's Price Weighting Distort It? Index Weighting Analysis in Python
August 10, 2026
What's the question?
The Dow Jones Industrial Average weights its thirty members by share price: the index is the sum of thirty closing prices divided by a constant called the divisor, so a company’s influence depends on what one of its shares costs rather than on what the company is worth. Every other major US index weights by market capitalisation, share price multiplied by shares outstanding.
Share price alone carries no economic meaning. A company can halve its share price by splitting its stock, and nothing about the business changes: same earnings, same assets, twice as many shares at half the price. Capitalisation weighting ignores the split; price weighting cuts the company’s place in the index in half. So the question has two parts: how far apart the two rules put the same thirty companies, and whether that gap changes what the index returns.
The approach
The sample is the thirty companies in the Dow on 29 May 2026, read as the roster stood that day. Both rules are applied to that one basket, so nothing but the weighting separates the results.
- Divide each member’s raw as-traded close by the sum of all thirty for the price weight, which is what the divisor produces. Repeat with market capitalisation, then group both by sector.
- Rebuild five years of daily returns from split-adjusted prices under each rule, 1 June 2021 to 29 May 2026. Price weights are the previous close restated onto the current share basis, so a split cuts a member’s weight the day it happens, as the divisor does. Capitalisation weights start from market capitalisation on the first day and are carried forward by price, the way a capitalisation-weighted index reweights itself between reconstitutions.
- Break the result down by member, to see how much of each index’s return came from its highest-priced names.
Code
import numpy as np
import pandas as pd
import xfinlink as xfl

xfl.set_api_key("YOUR_API_KEY")  # free at https://xfinlink.com/signup

START, SNAP = "2021-05-28", "2026-05-29"
tickers = sorted(xfl.index("djia", as_of=SNAP)["ticker"])

px = xfl.prices(tickers, start=START, end=SNAP, fields=["close", "adj_close"])
px["date"] = pd.to_datetime(px["date"])
close = px.pivot(index="date", columns="ticker", values="close").sort_index().ffill()
adj = px.pivot(index="date", columns="ticker", values="adj_close").sort_index().ffill()

def market_cap(on):
    df = xfl.metrics(tickers, period_type="daily", fields=["market_cap"], start=on, end=on)
    return df.set_index("ticker")["market_cap"].reindex(close.columns)

snap = pd.DataFrame({"price": close.iloc[-1], "mcap": market_cap(SNAP)})
snap["price_w"] = 100 * snap["price"] / snap["price"].sum()
snap["cap_w"] = 100 * snap["mcap"] / snap["mcap"].sum()

ret = adj.pct_change().iloc[1:]
w_price = close.reindex(ret.index).div(1 + ret)          # prior close, current share basis
growth = (1 + ret).cumprod()
growth.loc[close.index[0]] = 1.0
w_cap = growth.sort_index().mul(market_cap(START), axis=1).shift(1).reindex(ret.index)

def index_return(weights):
    w = weights.where(ret.notna())
    w = w.div(w.sum(axis=1), axis=0)
    return (w * ret).sum(axis=1)

r_price, r_cap = index_return(w_price), index_return(w_cap)

print(snap.sort_values("price_w", ascending=False).round(2))
print((snap["price_w"] - snap["cap_w"]).abs().sum() / 2)
for r in (r_price, r_cap):
    print((1 + r).prod() - 1, r.std() * np.sqrt(252))
Full script with formatting and visualisation: dow-price-weighting-vs-cap-weighting-python.py
Output
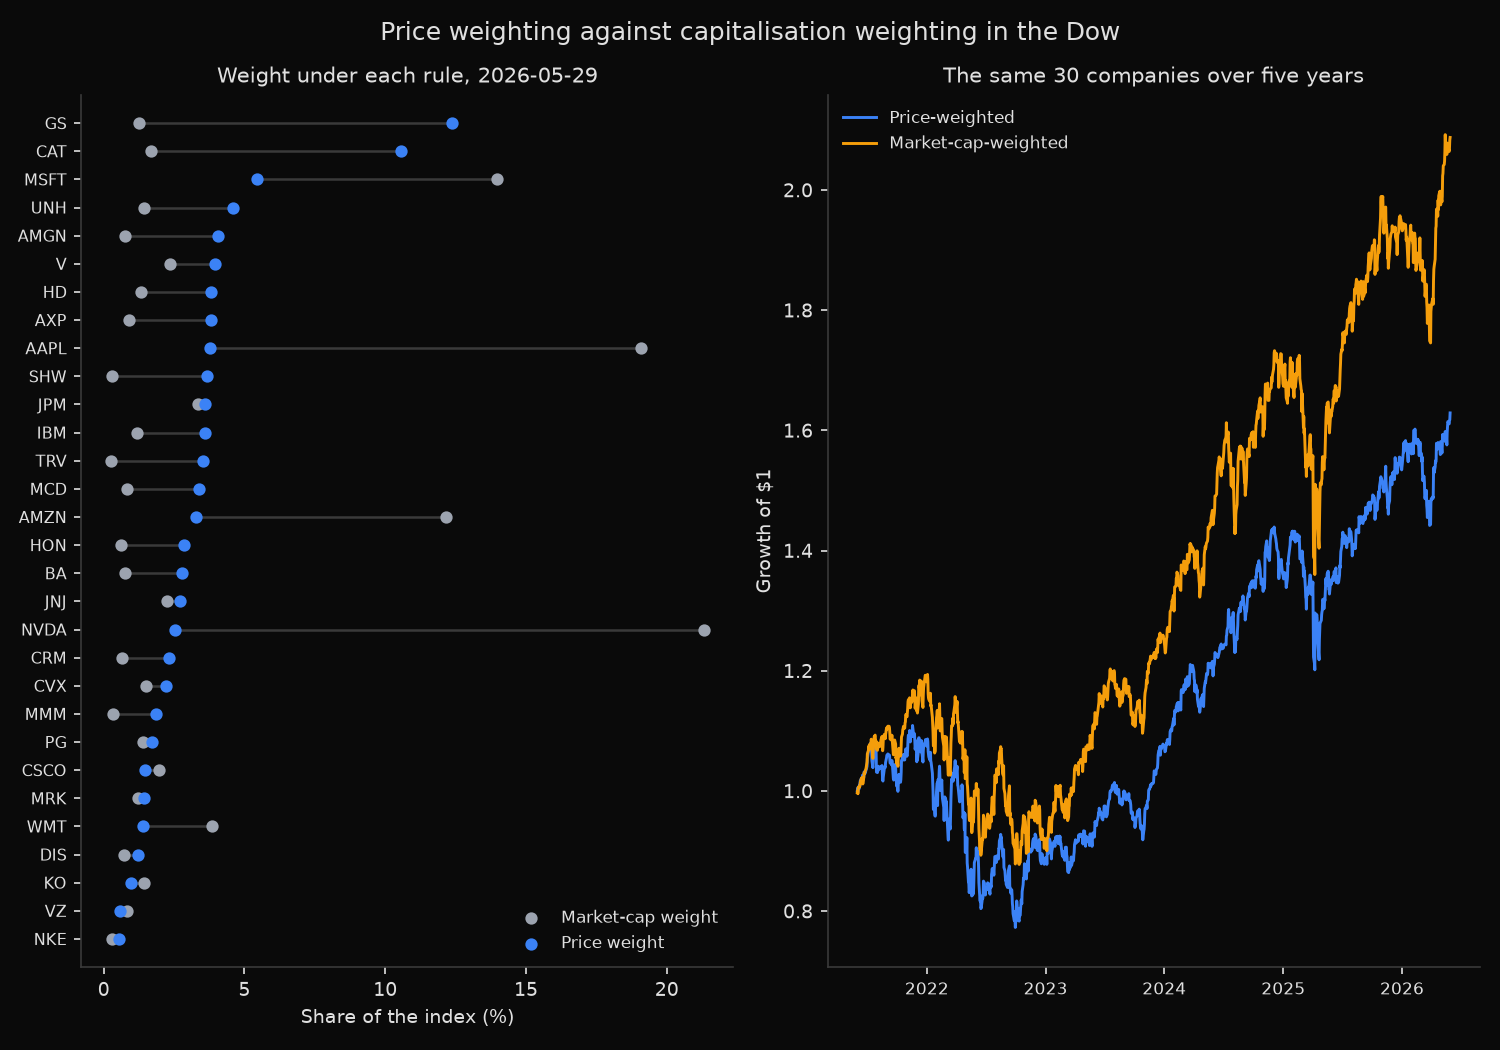
Dow Jones Industrial Average, 30 members at 2026-05-29
ticker company                         close $  price wt %  cap wt %   gap pp  ratio
GS     GOLDMAN SACHS GROUP INC        1,025.56       12.37      1.26   +11.11   9.82
CAT    CATERPILLAR INC                  875.87       10.57      1.68    +8.88   6.28
MSFT   MICROSOFT CORP                   450.24        5.43     13.95    -8.52   0.39
UNH    UNITEDHEALTH GROUP INC           380.31        4.59      1.44    +3.15   3.18
AMGN   AMGEN INC                        336.79        4.06      0.76    +3.30   5.36
V      VISA INC                         326.36        3.94      2.35    +1.58   1.67
HD     HOME DEPOT INC                   317.14        3.83      1.32    +2.51   2.90
AXP    AMERICAN EXPRESS CO              316.47        3.82      0.90    +2.92   4.24
AAPL   Apple Inc                        312.06        3.76     19.09   -15.33   0.20
SHW    SHERWIN WILLIAMS CO              303.84        3.67      0.31    +3.35  11.73
JPM    JPMORGAN CHASE & CO              299.31        3.61      3.35    +0.27   1.08
IBM    INTERNATIONAL BUSINESS MACHIN    297.80        3.59      1.17    +2.43   3.08
TRV    TRAVELERS COMPANIES INC          291.89        3.52      0.26    +3.26  13.60
MCD    MCDONALDS CORP                   279.20        3.37      0.83    +2.54   4.07
AMZN   AMAZON COM INC                   270.64        3.27     12.14    -8.88   0.27
HON    HONEYWELL INTERNATIONAL INC      237.86        2.87      0.63    +2.24   4.56
BA     BOEING CO                        231.15        2.79      0.76    +2.03   3.67
JNJ    JOHNSON & JOHNSON                225.33        2.72      2.26    +0.46   1.20
NVDA   NVIDIA CORP                      211.14        2.55     21.32   -18.77   0.12
CRM    SALESFORCE INC                   191.10        2.31      0.65    +1.65   3.53
CVX    CHEVRON CORP                     182.46        2.20      1.52    +0.69   1.45
MMM    3M CO                            153.13        1.85      0.33    +1.51   5.54
PG     PROCTER & GAMBLE CO              143.56        1.73      1.39    +0.34   1.24
CSCO   CISCO SYSTEMS INC                120.42        1.45      1.98    -0.53   0.73
MRK    MERCK & CO INC                   118.72        1.43      1.22    +0.21   1.17
WMT    WALMART INC                      115.75        1.40      3.84    -2.45   0.36
DIS    DISNEY WALT CO                   101.83        1.23      0.74    +0.49   1.67
KO     COCA COLA CO                      79.01        0.95      1.42    -0.46   0.67
VZ     VERIZON COMMUNICATIONS INC        47.81        0.58      0.83    -0.26   0.69
NKE    NIKE INC                          46.23        0.56      0.29    +0.27   1.95

Weight that would have to change hands to turn price weighting into cap weighting: 55.2%
  heaviest by price  GS 12.37% (cap weight 1.26%)
  heaviest by cap    NVDA 21.32% (price weight 2.55%)

Sector weight under each rule
                            price %    cap %
  Financials                  27.26     8.12
  Information Technology      19.09    58.16
  Industrials                 18.07     3.41
  Health Care                 12.80     5.68
  Consumer Discretionary      11.02    14.57
  Consumer Staples             4.08     6.66
  Materials                    3.67     0.31
  Energy                       2.20     1.52
  Communication Services       1.81     1.57

Same 30 companies, two weighting rules, 2021-06-01 to 2026-05-29 (1255 sessions)
                          price-weighted   cap-weighted   difference
cumulative return %                62.92         108.76       -45.84
annualised return %                10.30          15.93        -5.63
annualised volatility %            16.63          18.96        -2.33
maximum drawdown %                -30.31         -26.49        -3.82
daily correlation                 0.8827
tracking error % p.a.               8.91

What the five highest-priced members contributed (GS, CAT, MSFT, UNH, AMGN)
  under price weighting     23.9 pp of 55.7 pp (43% of the total)
  under cap weighting       16.0 pp of 82.5 pp (19% of the total)

Share splits inside the window: weight before and on the day, then the member's contribution from that day to the end
date                 split  price wt before  price wt on  cap wt on  price contrib  cap contrib
2021-07-20  NVDA        4:1            7.50%        2.08%      3.67%        17.25pp      29.22pp
2022-06-06  AMZN       20:1           31.92%        2.26%     10.28%         2.27pp       8.88pp
2024-02-26  WMT         3:1            2.47%        0.84%      2.96%         0.84pp       2.53pp
2024-06-10  NVDA       10:1           16.47%        1.94%     16.71%         1.33pp      12.02pp
What this tells us
The two rules disagree about most of the index: turning price weighting into capitalisation weighting requires 55.2 percent of it to change hands, leaving barely two fifths of the Dow weighted the way the rest of the market weights things.
Individual gaps run wider. Goldman Sachs, at $1,025.56 a share, is 12.37 percent of the Dow against a market value of 1.26 percent, nearly ten times the position its size warrants, while Travelers, smallest by market value at 0.26 percent, gets 3.52 percent. NVIDIA runs the other way, 21.32 percent of the combined market value against 2.55 percent by price, and Apple is understated fivefold. By sector, technology is 58.16 percent of the thirty by market value and 19.09 percent by price weight, while financials and industrials together are 45.33 percent by price and 11.53 percent by market value. Expensive shares cluster in banks, insurers and machinery.
Splits move these distortions, so none hold still. On 7 June 2024 NVIDIA was 16.47 percent of the price-weighted basket; on 10 June, when its ten-for-one split took effect, it was 1.94 percent, while its capitalisation weight sat unchanged at 16.71 percent. Over the two years that followed NVIDIA added 12.02 points to the capitalisation-weighted index and 1.33 to the price-weighted one. Amazon went from 31.92 percent of the basket to 2.26 percent on its twenty-for-one split. Both joined the real Dow only after splitting.
Across the five years the two series returned 62.92 and 108.76 percent from identical holdings, 5.63 points a year apart, correlating at 0.8827 with a tracking error of 8.91 percent. The price-weighted series is the quieter at 16.63 percent volatility against 18.96, yet it took the deeper 2022 drawdown, 30.31 percent against 26.49. Its five highest-priced members supplied 43 percent of its return; the same five gave 19 percent of the capitalisation-weighted return.
So what?
Treat the Dow as a distinct portfolio rather than a proxy for large-cap US equity: it is a 45 percent financials and industrials position carrying a third of the technology exposure the same thirty companies deliver under any other rule. That matters most when it serves as a benchmark or a hedge, since an 8.91 percent annual tracking error against a capitalisation-weighted basket of identical names means Dow futures hedge a large-cap book poorly.
One corporate action is worth watching for. A split by any large price weight shrinks that member on a single day with no economic cause, and the weight lands on the other twenty-nine: a two-for-one split by Goldman Sachs would take it from 12.37 percent to roughly 6.6 percent and lift every other member by about 6.6 percent of its own weight. Rebuild both weight vectors before any Dow-referenced trade, and size against the capitalisation weights the businesses justify.
Built with xfinlink — free financial data API for Python. pip install -U xfinlink
pip install -U xfinlink