BLOG

Behind the numbers.

Code examples, market analysis, and data quality deep-dives.

Do Healthcare Cash-Flow Margins Predict Returns? Signal Evaluation in Python
Which Dividend Stocks Survive a Cash-Flow Stress Test? Dividend Screening in Python
Does Heavy Insider Selling Predict Weak Returns? Insider Flow Test in Python
Can Quality Screens Reduce Small-Cap Balance-Sheet Risk? Russell 2000 Test in Python
Which Retailers Have Positive Operating Leverage? Margin Screening in Python
Is MSTR a Leveraged Bitcoin Proxy? Rolling Beta Analysis in Python
Is Micron's Memory Cycle Recovering? Inventory and Margin Forecasting in Python
Which Sectors Work When Bonds Rally? Rate-Sensitive Rotation in Python
Do One-Month Price Extremes Reverse? Signal Evaluation in Python
Do Low-Volatility S&P 500 Stocks Reduce Drawdowns? Factor Test in Python
Is AI Capex Paying Back Fast Enough? Revenue Hurdle Forecasting in Python
Could Shorter AI Asset Lives Hit Earnings? Depreciation Stress Test in Python
How Much AI Capex Risk Can a Portfolio Remove? Constrained Optimization in Python
Is the AI Capex Trade Crowded? Rolling Volatility and Sector Rotation in Python
Did the AI Boom Come From Existing S&P 500 Members? Point-in-Time Momentum Test in Python
Is AI Revenue Circular? Customer-Vendor Capex Loop Analysis in Python
Is the AI Trade Connected to Private Credit? Rolling Correlation Network in Python
Is Apollo More Balance-Sheet Sensitive Than Peers? Leverage Screen in Python
Are AI Earnings Supported by Cash Flow? Accrual and Capex Screen in Python
Can Defensive Stocks Hedge AI Drawdowns? Basket Regime Test in Python
How Fast Does the Market Price In Fed Decisions? FOMC Event Study in Python
How Much Are Options Sellers Overpaid? The Variance Risk Premium in Python
Which Companies Have the Worst Earnings Quality? Sloan Accrual Screen with Geographic Revenue Data in Python
Does the Oil-to-Gold Ratio Signal Recessions? XLE/GLD Backtest in Python
Is AI Spending Crowding Out Free Cash Flow? Capex Sustainability Across the Mag 7 in Python
Does a Long Energy / Short Bonds Portfolio Capture Inflation Surprises? Factor Construction in Python
Can a Hidden Markov Model Detect Oil Market Regimes? HMM Analysis in Python
Do Grain Prices Predict Food Inflation? Granger Causality Test in Python
Does the Corporate Credit Spread Predict Stock Market Crashes? BAA-AAA Spread Analysis in Python
Do Oil Stocks Hedge Inflation? Rolling Beta Analysis in Python
Which Stocks Are Most Rate-Sensitive? Equity Duration via Bond Beta in Python
Which Companies Have the Highest Accrual Ratios? Earnings Quality Screening in Python
Is Alpha Persistent or Decaying? Rolling Sharpe Ratio Analysis in Python
Are Markets Trending or Mean-Reverting? Hurst Exponent Analysis in Python
Is Consumer Discretionary vs Staples a Leading Indicator? XLY/XLP Ratio Analysis in Python
Does Heavy Capex Predict Future Stock Returns? Capital Expenditure Analysis in Python
How to Estimate Cost of Equity Using CAPM in Python
Is Volatility Predictable? Testing for Volatility Clustering in Python
Which Industrials Are Overleveraged? Net Debt to EBITDA Screening in Python
GM Before and After Bankruptcy: Why Entity Resolution Matters for Financial Data
What Is Adjusted Beta? Merrill Lynch Beta Shrinkage in Python
How Good Is a Stock Pick? Information Ratio and Tracking Error in Python
Do Stock Returns Follow a Normal Distribution? Testing for Fat Tails in Python
Which Large Caps Have the Highest Free Cash Flow Yield? FCF Screening in Python
Which Sectors Won Over 5 Years? Sector Rotation Analysis in Python
How to Forecast Stock Volatility with GARCH Models in Python
Are Stock Prices Mean-Reverting? Augmented Dickey-Fuller Test in Python
How to Calculate CAPM Alpha and Beta with Regression in Python
How to Compare Sector Sharpe Ratios and Sortino Ratios in Python
DELL: Why Stitching Historical Price Data Together Is Wrong
How to Analyze Drawdown and Recovery for Bank Stocks in Python
How to Screen SaaS Stocks by Revenue Growth and Cash Flow in Python
How to Screen REITs by Dividend Yield and Valuation in Python
How Correlated Are the Magnificent 7? Intra-Group Correlation in Python
AAPL vs XOM: Do Individual Stocks Have Seasonal Patterns?
How to Rank Large-Cap Stocks by Momentum in Python
How to Build a Multi-Endpoint Financial Dashboard in Python
How to Compare Volatility Across Energy Stocks in Python
How to Screen Healthcare Stocks by Valuation in Python
How to Build a Sector Correlation Matrix for Portfolio Diversification in Python
How to Find Oversold and Overbought Stocks Using Z-Scores in Python
How to Measure Earnings Quality: Cash Flow vs Net Income in Python
How to Build a Multi-Factor Stock Screen in Python (Value + Momentum + Quality)
How to Build a Simple DCF Model for Any Stock in Python
How to Screen Tech Stocks by Revenue Growth in Python
How to Screen Stocks by Balance Sheet Health in Python
Is "Sell in May" Real? SPY Monthly Seasonality Over 10 Years
How to Compare Sector Performance YTD Using Python
How to Track S&P 500 Additions and Removals Over Time in Python
How to Screen Dividend Stocks by Yield and Quality in Python
How to Calculate Max Drawdown and Recovery Time for Any Stock in Python
How to Compare Profitability Across Mega-Cap Tech Stocks in Python
Why Ticker Symbols Are Unreliable: The Recycling Problem Every Quant Should Know
How to Calculate and Compare Stock Volatility in Python
How to Screen Blue-Chip Stocks by P/E Ratio in Python
How to Track Companies Through Ticker Changes, Bankruptcies, and Renames in Python
S&P 500 Turnover: How Much the Index Has Changed Since 2010
How to Calculate Stock Beta and Correlation in Python
← All articles

Does Heavy Insider Selling Predict Weak Returns? Insider Flow Test in Python

What's the question?

Insider selling is often treated as a warning sign. The interpretation is not that simple. Executives sell stock for taxes, diversification, estate planning, and scheduled trading plans. A single sale usually says little. A cluster of large sales may be more informative because it can create supply pressure and reveal lower insider urgency to hold exposure.

The question is whether heavy insider-selling months were followed by weaker three-month returns in a high-growth equity group. The test focuses on monthly clusters rather than individual transactions.

The approach

The universe is TSLA, NVDA, AMZN, COIN, PLTR, CRM, ORCL, AVGO, and MSFT. Built from SEC EDGAR public filings and market data, the analysis uses open-market buys and sells over three years.

  1. Pull open-market insider buys and sells
  2. Aggregate transaction value by ticker and month
  3. Define net selling as open-market sells minus open-market buys
  4. Mark heavy-selling months as the top quartile of positive monthly net selling for each ticker
  5. Compare 63-trading-day returns after heavy-selling months with other insider-active months

The threshold is ticker-specific. That avoids comparing a mega-cap's dollar sales directly with a smaller company's sales.

Code

import xfinlink as xfl
import pandas as pd
import numpy as np

xfl.set_api_key("YOUR_API_KEY")  # free at https://xfinlink.com/signup

tickers = ["TSLA", "NVDA", "AMZN", "COIN", "PLTR", "CRM", "ORCL", "AVGO", "MSFT"]
ins = xfl.insiders(tickers, period="3y",
                   transaction_type=["open_market_buy", "open_market_sell"])
ins["month"] = pd.to_datetime(ins["transaction_date"]).dt.to_period("M").dt.to_timestamp("M")
ins["sell_value"] = np.where(ins["transaction_type"].eq("open_market_sell"), ins["transaction_value"], 0)
ins["buy_value"] = np.where(ins["transaction_type"].eq("open_market_buy"), ins["transaction_value"], 0)
monthly = ins.groupby(["ticker", "month"])[["sell_value", "buy_value"]].sum()
monthly["net_sell_value"] = monthly["sell_value"] - monthly["buy_value"]

prices = xfl.prices(tickers, period="3y", fields=["adj_close"])
print(monthly.sort_values("net_sell_value", ascending=False).head())

Full script with formatting and visualisation: insider-selling-forward-returns-python.py

Output

Ticker-level forward returns after heavy insider-selling months
=== Insider Selling Forward-Return Test ===
Transactions analyzed: 5,000
Event months with forward returns: 168
Heavy-selling definition: top quartile of positive monthly net selling per ticker
Heavy-selling months: 45, avg forward return    8.3%
Other insider-active months: 123, avg forward return   10.6%
Heavy-minus-other spread:   -2.3%

Ticker-level event results:
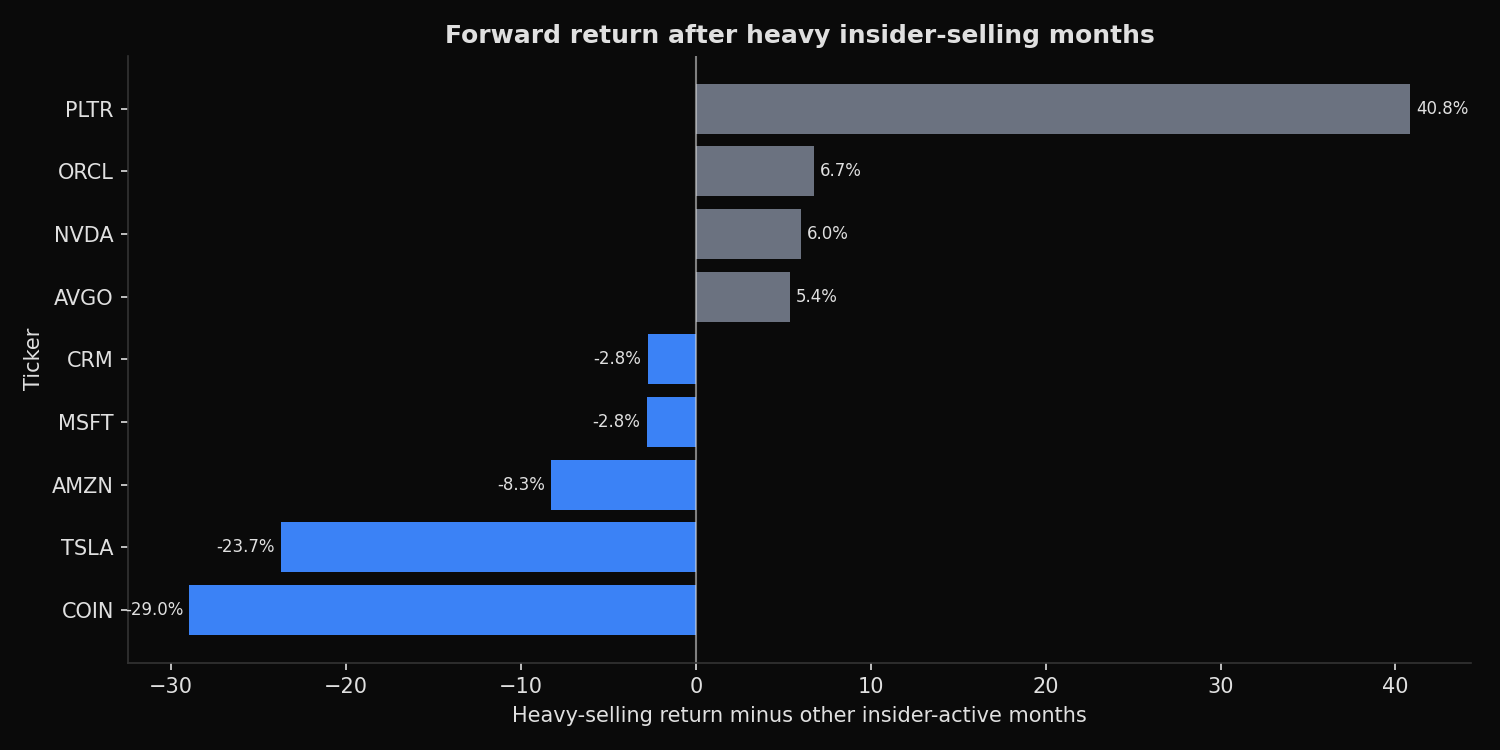
COIN  net_sell=  $1,678M  heavy_months= 6  heavy_fwd= -15.6%  other_fwd=  13.3%  spread= -29.0%
TSLA  net_sell=   $-229M  heavy_months= 5  heavy_fwd=  -5.9%  other_fwd=  17.8%  spread= -23.7%
AMZN  net_sell= $10,922M  heavy_months= 6  heavy_fwd=  -0.4%  other_fwd=   7.8%  spread=  -8.3%
MSFT  net_sell=    $271M  heavy_months= 4  heavy_fwd=  -3.6%  other_fwd=  -0.8%  spread=  -2.8%
CRM   net_sell=    $576M  heavy_months= 5  heavy_fwd=  -5.0%  other_fwd=  -2.2%  spread=  -2.8%
AVGO  net_sell=  $1,022M  heavy_months= 4  heavy_fwd=  18.5%  other_fwd=  13.1%  spread=   5.4%
NVDA  net_sell=  $3,613M  heavy_months= 6  heavy_fwd=  10.6%  other_fwd=   4.6%  spread=   6.0%
ORCL  net_sell=  $3,124M  heavy_months= 4  heavy_fwd=  15.4%  other_fwd=   8.6%  spread=   6.7%
PLTR  net_sell=  $4,368M  heavy_months= 5  heavy_fwd=  68.0%  other_fwd=  27.2%  spread=  40.8%

What this tells us

Heavy insider-selling months underperformed other insider-active months in aggregate. The difference was -2.3 percentage points over 63 trading days. COIN, TSLA, and AMZN produced the clearest negative spreads.

The result is not universal. PLTR, ORCL, NVDA, and AVGO had positive spreads after heavy-selling months. That means insider selling was not a mechanical bearish signal in this sample. For momentum-led stocks, insider selling can occur during powerful price trends and still be followed by positive returns.

The useful interpretation is conditional. Heavy selling matters more when it appears alongside weakening price action, valuation pressure, or deteriorating fundamentals. By itself, it is a supply and sentiment signal, not a complete thesis.

So what?

Insider flow belongs in a risk dashboard, not in isolation. A large selling cluster should trigger a review of valuation, technical trend, and upcoming catalysts. If all three are weak, insider selling can strengthen the risk case. If price momentum and fundamentals remain strong, the sale may be routine diversification.

For portfolio risk management, the screen is most useful for position review. It identifies names where insiders are reducing exposure at the same time public-market investors may still be extrapolating growth.

Built with xfinlink — free financial data API for Python. pip install xfinlink

Built with xfinlink — free financial data API for Python. pip install xfinlink
← All articles