

Data Requirements for Backtesting a Trading Strategy
July 28, 2026
A backtest needs four things from its data before the strategy logic matters at all: prices that survive corporate actions, returns that count dividends, a universe drawn as it stood on each formation date, and identifiers that keep pointing at the same company when a ticker gets reassigned. History depth sets the ceiling on all four. Get one of them wrong and the equity curve measures the data rather than the idea.
Which price column should a backtest use?
Not the raw traded close, and the reason shows up in any split.
NVIDIA declared a ten-for-one forward split on 22 May 2024. Each holder of record on 6 June received nine additional shares, distributed after the close on Friday 7 June, and trading opened on a split-adjusted basis on Monday 10 June. Nothing about the value of a position changed over that weekend. The printed price changed by a factor of ten.
import xfinlink as xfl
xfl.set_api_key("YOUR_API_KEY")  # free at https://xfinlink.com/signup

df = xfl.prices("NVDA", start="2024-06-05", end="2024-06-12",
                fields=["close", "adj_close", "split_ratio", "dividend"])
print(df.drop(columns=["gics_sector"]).to_string(index=False))
Output:
 entity_id ticker entity_name       date      close  adj_close  split_ratio  dividend
     29109   NVDA NVIDIA CORP 2024-06-05 1224.40002 122.440002          NaN       NaN
     29109   NVDA NVIDIA CORP 2024-06-06 1209.97998 120.997998          NaN       NaN
     29109   NVDA NVIDIA CORP 2024-06-07 1208.88000 120.888000          NaN       NaN
     29109   NVDA NVIDIA CORP 2024-06-10  121.79000 121.790000         10.0       NaN
     29109   NVDA NVIDIA CORP 2024-06-11  120.91000 120.910000          NaN      0.01
     29109   NVDA NVIDIA CORP 2024-06-12  125.20000 125.200000          NaN       NaN
Friday’s raw close of $1,208.88 becomes Monday’s $121.79. A backtest differencing that column books an 89.93% single-day loss on a stock that went up. The adj_close column restates the earlier history onto the current share basis, so the same Monday reads 120.888 to 121.790, a gain of 0.75%, which is what the holder actually experienced. split_ratio carries the factor of 10 on the event date, so a corporate action can be detected rather than inferred from a suspicious return.
Do the returns include dividends?
Read the next row down. 11 June 2024 was the record date for NVIDIA’s raised quarterly dividend, $0.10 per share before the split, which the company described as “equivalent to $0.01 per share on a post-split basis”. The close fell from 121.79 to 120.91, a price return of -0.7226%. The cash did not evaporate; it left the share price and arrived in the holder’s account, so the return that holder earned is (120.91 + 0.01) / 121.79 - 1, or -0.7143%. The dividend column carries the payment on the row where it went ex, which is what makes that arithmetic possible without a second source.
Under one basis point, on one day, on a stock with a token yield. A company paying 3% a year loses roughly three points annually to the same omission, compounding across the length of the test, and the size of the error scales with the yield, so it lands hardest on the income and value names those strategies select. The requirement is not one magic column but a payout series aligned to the price series: take adj_close for a split-consistent level, and add the dividend back on the rows where it went ex whenever the strategy is judged on total return rather than price alone.
How much history is enough?
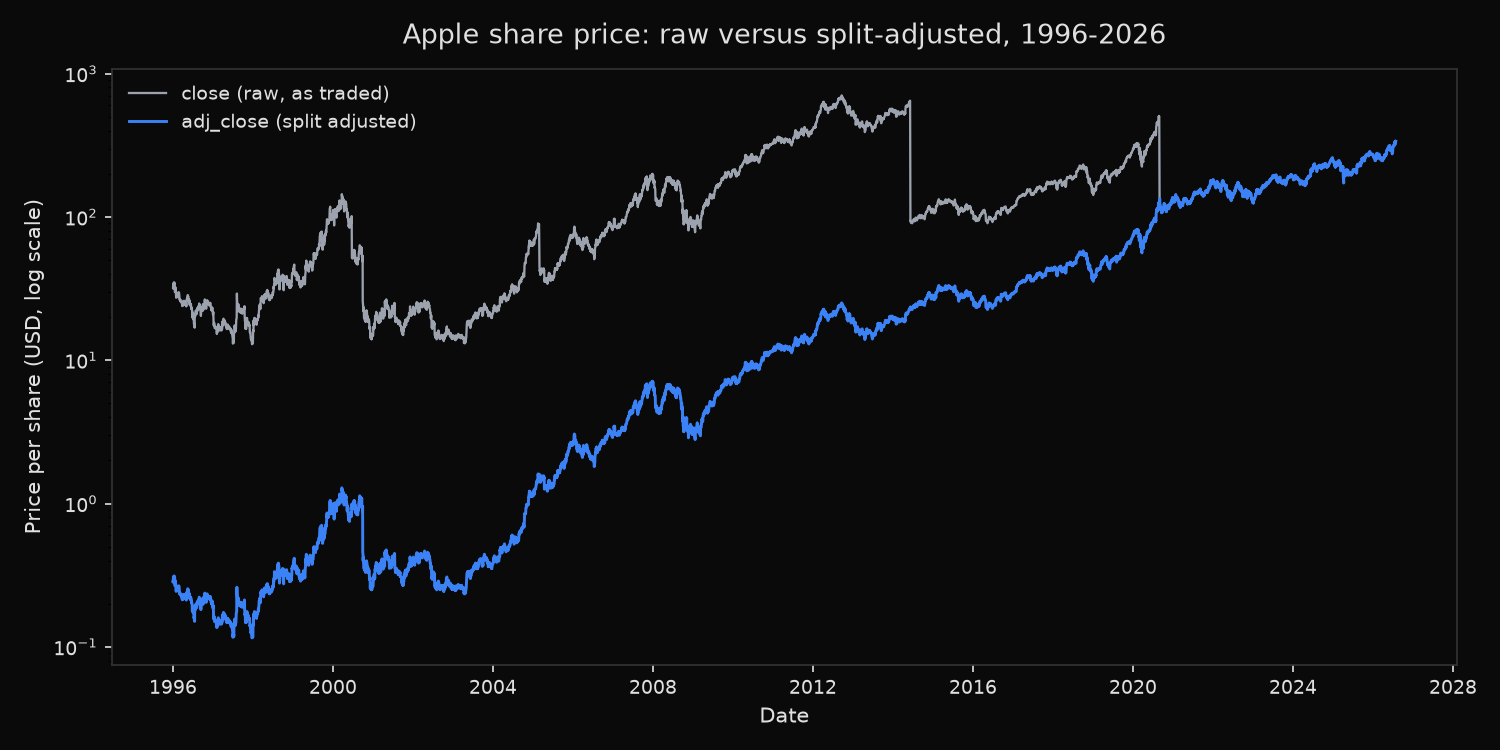
Apple’s daily series runs from 2 January 1996 to 27 July 2026, 7,691 trading sessions. The first raw close is $32.125 and the first adjusted close is $0.28683. That ratio is 112, which is exactly 2 × 2 × 7 × 4: the four splits Apple has run since 1996, in June 2000, February 2005, June 2014 and August 2020, each listed on the company’s own investor FAQ. The grey line is the file an unadjusted feed hands over, cliffs included.
Depth decides which questions a backtest is allowed to answer. A ten-year window reaches 2016 and contains neither the 2008 credit crisis nor the 2000 technology unwind, so a rule fitted inside it has never been asked what happens when correlations converge and liquidity leaves. The volatility-targeting test on this blog spans 2007 to 2026 for that reason, and the conclusion changes depending on whether 2008 sits inside the sample.
A rolling one-year window, which is what a free xfinlink key serves, covers building the pipeline and checking that the join keys line up. Anything multi-decade needs the $29 Pro plan, where daily prices reach 1996 and financial statements reach 1950.
Which companies belong in the universe on each date?
The ones that were in it then, including the ones that later failed. A universe taken from a current index list has already had every bankruptcy and buyout removed by the passage of time, and the resulting backtest reports returns that were not available to anyone. The mechanics of the correction, and a measured example of the damage, are in the guide on survivorship bias in backtesting.
Two capabilities cover the requirement. Membership as of a date, xfl.index("sp500", as_of="2016-07-29"), gives the roster the strategy would have seen. Price history that continues past a delisting gives each departed name a final mark instead of a gap the code has to guess at.
Does the ticker still mean the same company?
Ticker strings get recycled, and a backtest keyed on the string will join two unrelated businesses without raising an error. Every frame above carries entity_id 29109 next to NVDA, and that identifier stays with the company through renames and symbol changes; the entity resolution walkthrough shows the same mechanism holding META, GM and DELL together across their symbol history. Keying a backtest on the identifier rather than the symbol costs one column and removes an entire class of silent error.
What do the common sources give you?
Every figure below was read off the provider’s own pages on 28 July 2026.
| Source | Adjusted prices | Free access |
|---|---|---|
| yfinance | download() takes an auto_adjust argument, documented as “Adjust all OHLC automatically”, default True |
No key; the docs state the project is “not affiliated, endorsed, or vetted by Yahoo, Inc.” and is “intended for research and educational purposes” |
| Alpha Vantage | TIME_SERIES_DAILY returns a “raw (as-traded) daily time series”; adjusted close plus split and dividend events come from TIME_SERIES_DAILY_ADJUSTED, which the documentation labels “a premium API function” |
25 API requests per day |
| Massive (polygon.io redirects here) | The Stocks Basic feature list includes “Corporate Actions” | Stocks Basic at $0/month: “5 API Calls / Minute”, “2 Years Historical Data”, “End of Day Data”, “Individual use” |
| xfinlink | close raw as traded, adj_close split-adjusted, split_ratio and dividend sitting on the event date so both corporate actions and total return can be reconstructed |
100 requests per day on a rolling one-year window |
Sources in row order: the yfinance download reference and its documentation home; the Alpha Vantage documentation and premium page; massive.com/pricing, reached because polygon.io returns a 301 redirect to massive.com; the xfinlink docs and pricing page.
Adjusting by default, as yfinance does, is the friendlier choice for someone plotting a chart, and it costs nothing until the day a reconciliation against a broker statement or a filing needs the price that actually traded. At that point the raw column has to exist somewhere. Serving both, with the split factor and the cash dividend sitting on the row where the event happened, is what lets one query answer the performance question and the audit question without a second source and a merge that has to be trusted.
FAQ
Is adjusted close enough on its own?
No. Split adjustment removes the artificial cliffs, but total return needs the dividends as well, and a split-adjusted price series does not contain them. Read adj_close for levels, and add the dividend column back on ex-date rows to compound a total return.
How far back should a backtest start?
Far enough to include at least one market regime the strategy was not fitted to. A window opening after 2009 does not contain the 2008 credit crisis, so the worst drawdown it reports is a lower bound rather than a measurement.
Can a backtest run on a free API tier?
Building and debugging one, yes. A multi-decade test across a full index needs the deeper history and the wider per-call ticker caps that paid plans carry, because a rolling one-year window cannot answer a question about 2008.
Should trades fill at the open or the close?
Whichever the data supports honestly. A signal computed on today’s close cannot be filled at today’s close without borrowing information from the future, so a daily source needs the open as well, and the price frames above carry open, high, low and close on every row.
Built with xfinlink — free financial data API for Python. pip install xfinlink
pip install xfinlink