
What’s the question?
A large cash balance reads as a defensive quality. A company holding a quarter of its assets in cash and short-term investments can meet payroll through a revenue collapse, avoid refinancing at panic prices, and buy assets from weaker competitors while they are cheap. That reasoning is sound for the individual company, and it implies something testable about prices: when the whole market falls, shares of cash-rich companies should fall less than shares of companies running on thin liquidity.
The cash ratio used here is cash and short-term investments divided by total assets, taken from the last annual report published well before the decline started. Whether it works as a drawdown defence is a separate question from whether it keeps a company alive, and a screen sold on the second is usually bought for the first. Leverage gets the same treatment in a test of net debt against drawdowns.
The approach
Three peak-to-trough declines in the S&P 500 make up the test: the fourth quarter of 2018, the pandemic crash of February and March 2020, and the bear market that ran from January to October 2022. Each had a different cause, and a defensive property that only works against one kind of shock is not a defensive property.
- Rebuild index membership as of the first day of each window, addressed by company identifier rather than ticker, so companies that later left the index are still counted.
- Drop financials and real estate. Cash on a bank balance sheet is inventory rather than a buffer, and mixing the two definitions would corrupt the sort.
- Take the most recent annual report ending at least six months before the window opens, the standard reporting lag, so the sort uses only figures available at the time.
- Compute cash and short-term investments over total assets, then sort into quintiles inside each window.
- Measure each company’s worst split-adjusted close during the window against the close it opened at, requiring most of the window’s trading days to be present.
- Repeat the sort with sector held fixed, subtracting each window-and-sector average from both the cash ratio and the fall.
Step 6 carries the weight. Cash intensity varies enormously across industries for reasons unrelated to prudence, so an unconditional sort risks measuring sector membership and calling it liquidity.
Code
import pandas as pd
from scipy import stats
import xfinlink as xfl

xfl.set_api_key("YOUR_API_KEY")  # free at https://xfinlink.com/signup

members = xfl.index("sp500", as_of="2022-01-03")
ids = sorted(set(members["entity_id"]))

fund = xfl.fundamentals(entity_id=ids, start="2014-01-01", end="2021-07-03",
                        period_type="annual",
                        fields=["cash_and_short_term_investments", "total_assets"])
fund = fund.dropna(subset=["cash_and_short_term_investments", "total_assets"])
fund = fund.loc[fund.groupby("entity_id")["period_end"].idxmax()]
fund = fund[~fund["gics_sector"].isin({"Financials", "Real Estate"})]
fund["cash_ratio"] = fund["cash_and_short_term_investments"] / fund["total_assets"]

px = xfl.prices(entity_id=fund["entity_id"].tolist(), start="2022-01-03",
                end="2022-10-12", fields=["adj_close"], max_rows=500000)
grp = px.sort_values(["entity_id", "date"]).groupby("entity_id")["adj_close"]
fund = fund.set_index("entity_id")
fund["drawdown"] = (grp.min() / grp.first() - 1.0) * 100.0

fund["quintile"] = pd.qcut(fund["cash_ratio"], 5, labels=[1, 2, 3, 4, 5]).astype(int)
print(fund.groupby("quintile")["drawdown"].mean().round(2))
Full script with formatting and visualisation: cash-balance-drawdown-cushion-python.py
Output
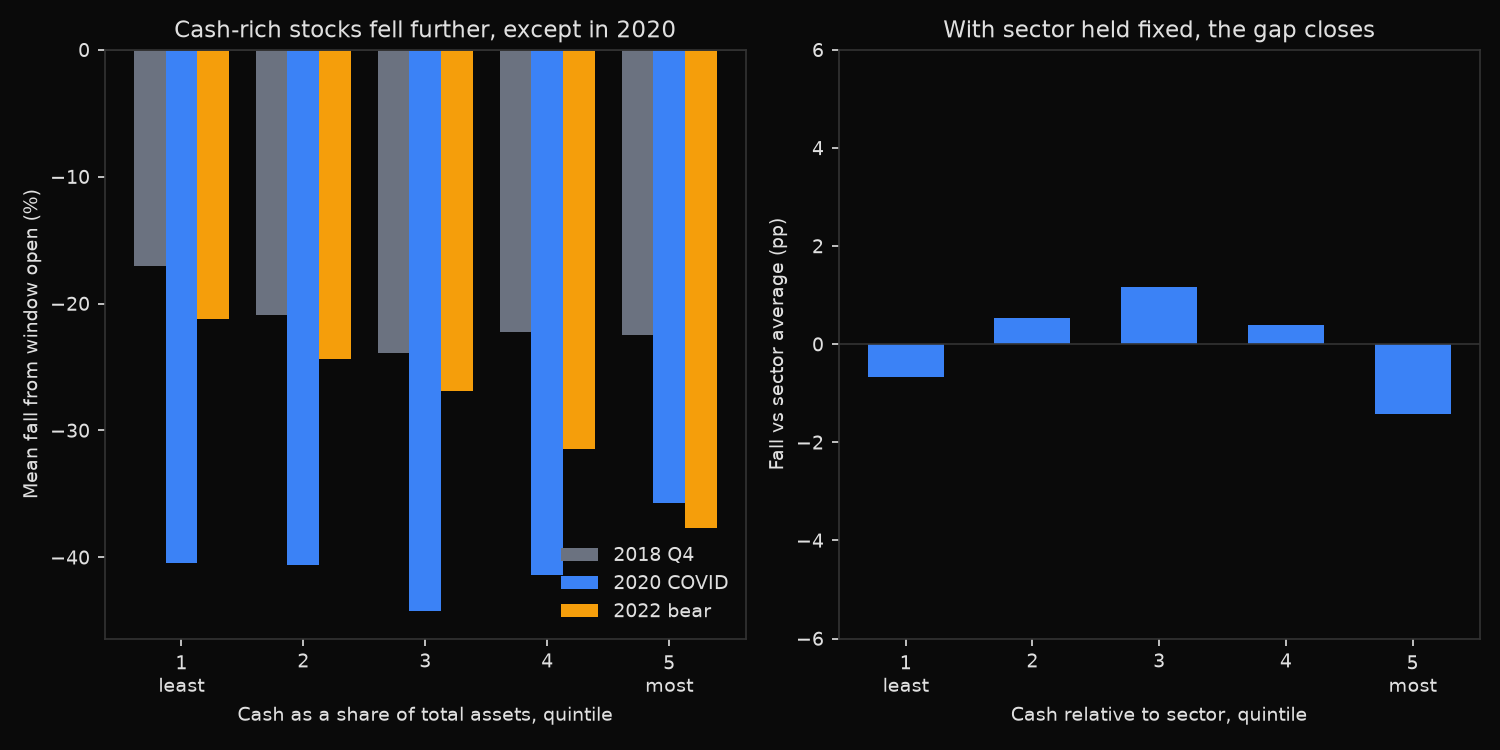
Mean drawdown (%) by cash quintile
window    2018 Q4  2020 COVID  2022 bear  Pooled
quintile
1          -17.01      -40.46     -21.25  -26.36
2          -20.87      -40.63     -24.38  -28.69
3          -23.91      -44.19     -26.87  -31.75
4          -22.22      -41.36     -31.50  -31.82
5          -22.47      -35.72     -37.70  -32.18

Mean cash / total assets by quintile
quintile
1    0.0099
2    0.0378
3    0.0753
4    0.1327
5    0.2871

Quintile 5 minus quintile 1
2018 Q4      -5.46pp  t=-2.58  p=0.0109  n=72/72
2020 COVID   +4.74pp  t=+2.02  p=0.0449  n=76/76
2022 bear   -16.45pp  t=-6.53  p=0.0000  n=78/78
Pooled       -5.82pp  t=-3.70  p=0.0002  n=226/226

Sector-neutral: drawdown relative to the window's sector average (pp)
q_sn
1   -0.66
2    0.53
3    1.16
4    0.39
5   -1.42
Q5 minus Q1  -0.76pp  t=-0.64  p=0.5212

Sector averages, all three windows pooled
                        drawdown  cash_ratio    n
gics_sector
Consumer Discretionary   -38.505       0.133  176
Energy                   -35.808       0.065   72
Information Technology   -32.832       0.200  173
Communication Services   -31.717       0.127   54
Materials                -31.280       0.065   77
Industrials              -30.991       0.084  215
Health Care              -25.574       0.124  174
Consumer Staples         -20.147       0.067  103
Utilities                -19.721       0.014   82

1126 company-window observations, 427 companies
What this tells us
Pooled across the three declines, the cash-rich quintile fell 5.82 percentage points further than the cash-poor quintile, at t = -3.70. The sign is the opposite of what the defensive argument predicts. Reading only that line, a screener would conclude that cash is a liability in a selloff.
The per-window rows show why that conclusion would be wrong. In 2022 the spread is -16.45 points and overwhelming; in the fourth quarter of 2018 it is -5.46; in the pandemic crash it reverses to +4.74, with cash-rich companies falling almost five points less. One decline out of three behaves the way the theory says it should.
The sector table resolves the contradiction. Information technology carries an average cash ratio of 0.200, the highest of any sector, and fell 32.8 per cent. Utilities carry 0.014, the lowest, and fell 19.7 per cent. Sorting companies on cash therefore sorts them largely on whether they are technology companies, and long-duration growth equity fell hard in 2018 and harder in 2022 when discount rates rose.
Holding sector fixed removes the effect entirely. The sector-neutral spread is -0.76 points with t = -0.64, indistinguishable from zero, and the quintile means wander between -1.42 and +1.16 without order. Within an industry, companies holding more cash than their peers did not fall less than their peers.
The 2020 exception fits this reading rather than contradicting it. That crash was a funding shock, brief and violent, in which access to cash determined who had to raise capital at the worst moment. It is the one case where the balance sheet buffer pays, and it produces the only positive spread in the table.
So what?
Cash as a share of assets should not be used as a standalone defensive screen. It carries a sector bet far larger than the liquidity signal inside it, and over the last decade that bet has usually pointed the wrong way for anyone seeking downside protection. Ranking the S&P 500 on cash and holding the top fifth produced a technology-heavy portfolio wearing a defensive label.
Neutralising by sector is the minimum correction and costs four lines of code. Once applied, the signal is not there, which is worth establishing before it enters a risk model.
The residual use is narrower and real. Cash matters against funding shocks, where refinancing markets close and the question is who must sell assets to survive the quarter. Pairing the cash ratio with near-term debt maturities, and testing it against 2020 rather than a general market decline, is the version of this screen with evidence behind it.