
Did Earnings or the Multiple Drive the Last Decade of Returns? Return Decomposition in Python
September 2, 2026
What’s the question?
The price of a share is earnings per share multiplied by the price/earnings multiple, so a stock’s return comes from three sources and no others: the business earning more per share, investors paying more for each dollar of those earnings, and the cash paid out along the way.
Separating them matters because they have different half-lives. Earnings growth repeats; a re-rating from 15 times earnings to 30 times is a one-time payment from a change in sentiment, and it cannot happen twice without reaching 60 times. The usual account of 2014 to 2024 is that cheap money re-rated American equities, and that this rather than corporate performance produced the returns. This tests the account company by company.
The approach
Logarithms make the decomposition additive, so the three pieces sum exactly to the annualised total return.
- Take the point-in-time S&P 500 roster as it stood at the end of 2024, carrying every company by entity identifier so that a ticker change does not split one history into two.
- Pull diluted earnings per share for fiscal 2014 and fiscal 2024, and the closing price of the month each fiscal year ended in. A price paired with the earnings of the year it belongs to gives the multiple at each end.
- Compound monthly total returns between those two months, and read the price-only return from the split-adjusted close. The gap is the dividend contribution.
- Subtract the change in the multiple from the price return. What remains is per-share earnings growth, adjusted for splits and for any change in the share count.
Financials and real estate are set aside, since bank earnings answer to borrowing and provisioning and property earnings to depreciation conventions. Companies that lost money in either endpoint year drop out, because a multiple on a loss has no reading, as do those whose multiple sits outside 5 to 150. That leaves 279 companies.
Code
import numpy as np
import pandas as pd
import xfinlink as xfl

xfl.set_api_key("YOUR_API_KEY")  # free at https://xfinlink.com/signup

roster = xfl.index("sp500", as_of="2024-12-31")
ids = sorted(int(i) for i in roster["entity_id"].dropna().unique())

fun = xfl.fundamentals(entity_id=ids, start="2013-12-01", end="2025-06-30",
                       period_type="annual", fields=["eps_diluted"], max_rows=40000)
fun = fun[fun["fiscal_year"].isin([2014, 2024])]
fun = fun.sort_values("period_end").drop_duplicates(["entity_id", "fiscal_year"], keep="last")
a = fun[fun.fiscal_year == 2014].set_index("entity_id")
b = fun[fun.fiscal_year == 2024].set_index("entity_id")
pair = pd.DataFrame({"eps0": a["eps_diluted"], "d0": a["period_end"],
                     "eps1": b["eps_diluted"], "d1": b["period_end"],
                     "ticker": b["ticker"], "sector": b["gics_sector"]}).dropna()

px = xfl.prices(entity_id=sorted(int(i) for i in pair.index),
                start="2014-01-01", end="2025-06-30", interval="1mo",
                fields=["close", "adj_close", "return_daily"], max_rows=50000)
px["m"] = px["date"].dt.to_period("M")

rows = []
for eid, g in px.groupby("entity_id"):
    g = g.sort_values("date").reset_index(drop=True)
    r = pair.loc[eid]
    m0, m1 = r["d0"].to_period("M"), r["d1"].to_period("M")
    i0, i1 = int(g.index[g["m"] == m0][0]), int(g.index[g["m"] == m1][0])
    b0, b1 = g.loc[i0], g.loc[i1]
    years = (m1 - m0).n / 12.0

    log_total = float(np.log1p(g.loc[i0 + 1:i1, "return_daily"]).sum())
    log_price = float(np.log(b1["adj_close"] / b0["adj_close"]))
    log_mult = float(np.log((b1["close"] / r["eps1"]) / (b0["close"] / r["eps0"])))

    rows.append({"ticker": r["ticker"], "sector": r["sector"],
                 "earn": (log_price - log_mult) / years, "mult": log_mult / years,
                 "divs": (log_total - log_price) / years, "total": log_total / years})

res = pd.DataFrame(rows)
print(res[["total", "earn", "mult", "divs"]].median() * 100)
Full script with formatting and visualisation: earnings-vs-multiple-return-decomposition-python.py
Output
Point-in-time S&P 500 roster at 2024-12-31, fiscal 2014 to fiscal 2024
companies with a readable multiple at both ends: 279
window length in years, min/median/max: 8.92 / 10.00 / 10.08
median multiple, start 22.1  end 23.4
identity check, max |earnings + multiple + dividends - total|: 5.6e-17

annualised contribution to total return, percentage points
          total  earnings  multiple  dividends
10th pct   2.60     -2.82     -6.99       0.00
25th pct   6.22      2.94     -2.74       0.82
median    10.57      7.76      0.56       1.92
75th pct  14.90     13.21      4.17       3.17
90th pct  19.58     20.26      7.01       4.39
mean          10.89  8.28  0.36  2.25

multiple expanded over the decade:          55.2%
multiple contributed more than earnings:    21.5%
multiple was the largest of the three:      16.1%
multiple compressed and the stock still rose: 41.2%
earnings per share fell and the stock still rose: 11.5%

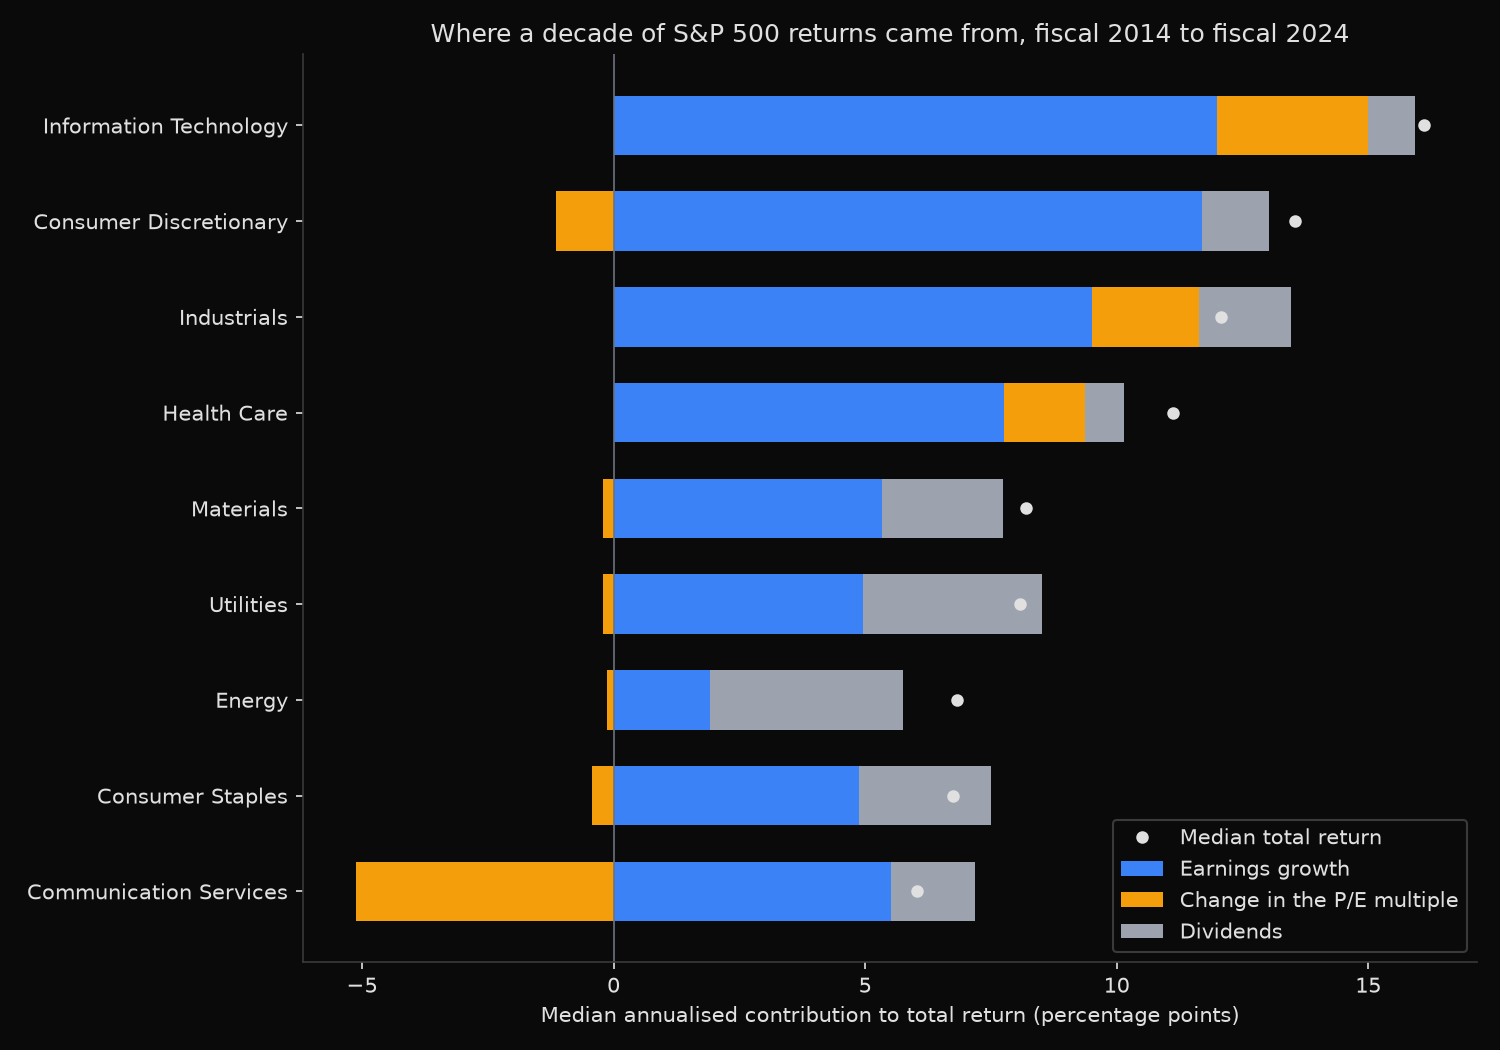
by sector, median annualised contribution in percentage points
                         n  earnings  multiple  dividends  total
sector
Information Technology  44     12.00      3.00       0.93  16.11
Consumer Discretionary  33     11.70     -1.15       1.32  13.54
Industrials             60      9.50      2.14       1.83  12.07
Health Care             43      7.76      1.61       0.77  11.12
Materials               18      5.33     -0.21       2.41   8.19
Utilities               28      4.96     -0.21       3.55   8.08
Energy                  18      1.92     -0.13       3.83   6.82
Consumer Staples        23      4.87     -0.42       2.63   6.74
Communication Services  12      5.51     -5.12       1.67   6.04

the eight largest re-ratings up, annualised percentage points
ticker                                   name  pe0   pe1  earn  mult  divs  total
    MU                  MICRON TECHNOLOGY INC 12.8 137.5 -12.9  23.7   0.2   11.0
   GLW                            CORNING INC 13.3  81.9 -10.9  18.2   2.7   10.0
   STX        SEAGATE TECHNOLOGY HOLDINGS PLC 12.6  65.4 -10.5  16.5   4.9   10.9
  FICO                        FAIR ISAAC CORP 20.3  95.0  20.2  15.5   0.0   35.7
   IFF INTERNATIONAL FLAVORS & FRAGRANCES INC 20.0  89.0 -16.7  14.9   2.4    0.6
   TFX                           TELEFLEX INC 28.0 120.3 -10.2  14.6   0.6    5.0
    EL                   LAUDER ESTEE COS INC 24.3  98.5 -10.4  14.0   1.2    4.8
   MSI                 MOTOROLA SOLUTIONS INC 12.7  50.1   5.6  13.7   1.7   21.0

the eight largest re-ratings down, annualised percentage points
ticker                          name   pe0  pe1  earn  mult  divs  total
  REGN REGENERON PHARMACEUTICALS INC 133.6 18.6  25.2 -19.7   0.0    5.5
   NRG              N R G ENERGY INC 117.2 18.1  30.8 -18.7   2.3   14.4
   DAL           DELTA AIR LINES INC  63.1 11.4  19.2 -17.1   1.2    3.3
   OXY     OCCIDENTAL PETROLEUM CORP 102.0 20.2  11.3 -16.2   3.4   -1.5
   CNC                  CENTENE CORP  46.2  9.6  24.2 -15.7   0.0    8.5
  TMUS              T MOBILE U S INC  89.8 22.8  34.7 -13.7   0.2   21.3
  MPWR  MONOLITHIC POWER SYSTEMS INC  55.9 16.2  37.2 -12.4   0.9   25.7
  ADBE                     ADOBE INC 139.0 41.7  31.5 -12.0  -0.0   19.5
What this tells us
The re-rating story does not survive the arithmetic. The median company returned 10.57 percent a year: 7.76 points from growing earnings per share, 1.92 from dividends and 0.56 from paying more for those earnings. Means, where the pieces sum exactly, give 10.89 percent split as 8.28, 2.25 and 0.36. The multiple accounts for something between a twentieth and a thirtieth of the typical return; the business did the rest.
The median multiple went from 22.1 times earnings to 23.4, a re-rating of about 6 percent spread over ten years. Composition explains why that is smaller than the index-level account suggests: the index multiple rose partly because the largest and most expensive companies grew into a bigger share of it, which is a weighting effect rather than something that happened to the typical constituent.
Across individual names the multiple mattered enormously and then cancelled out. It expanded for 55.2 percent of companies and compressed for the rest, and its 10th percentile of minus 6.99 points a year against a 90th of plus 7.01 is a symmetric 14-point spread around a 0.56 point median. Micron gained 23.7 points a year from re-rating while earnings per share fell 12.9, which is what a cyclical business looks like measured from a strong year into a weak one. Regeneron ran the trade backwards: earnings compounded at 25.2 percent, the stock returned 5.5, and a multiple falling from 134 to 19 took the difference.
For 21.5 percent of companies the multiple contributed more than earnings did; for 16.1 percent it was the largest of the three sources. Against that, 41.2 percent earned a positive return while the multiple worked against them. Sector medians follow earnings rather than sentiment: information technology led at 16.11 percent a year, of which 12.00 points are earnings growth against 3.00 from the multiple, and communication services is the single clear re-rating loss at minus 5.12 points.
So what?
When a factsheet attributes a decade of performance to a company’s quality, split the return before accepting the claim. Two earnings figures, two prices and one total return series are enough. If more than a third of the annualised return came from the multiple, the position has already collected the re-rating and the next decade has to come from earnings alone.
The same split caps forward expectations. A stock that reached 40 times earnings from 15 cannot repeat the journey without reaching 100, so extrapolating its historical return quietly assumes a multiple path with no room left. Strip that contribution out, keep the earnings growth and the dividend yield, and the remainder is the honest base case. The ratio of the earnings contribution to the total is the screen worth keeping: it separates companies that earned their returns from companies that were repriced, and the two behave very differently when the discount rate moves.
Built with xfinlink — free financial data API for Python. pip install -U xfinlink
pip install -U xfinlink