
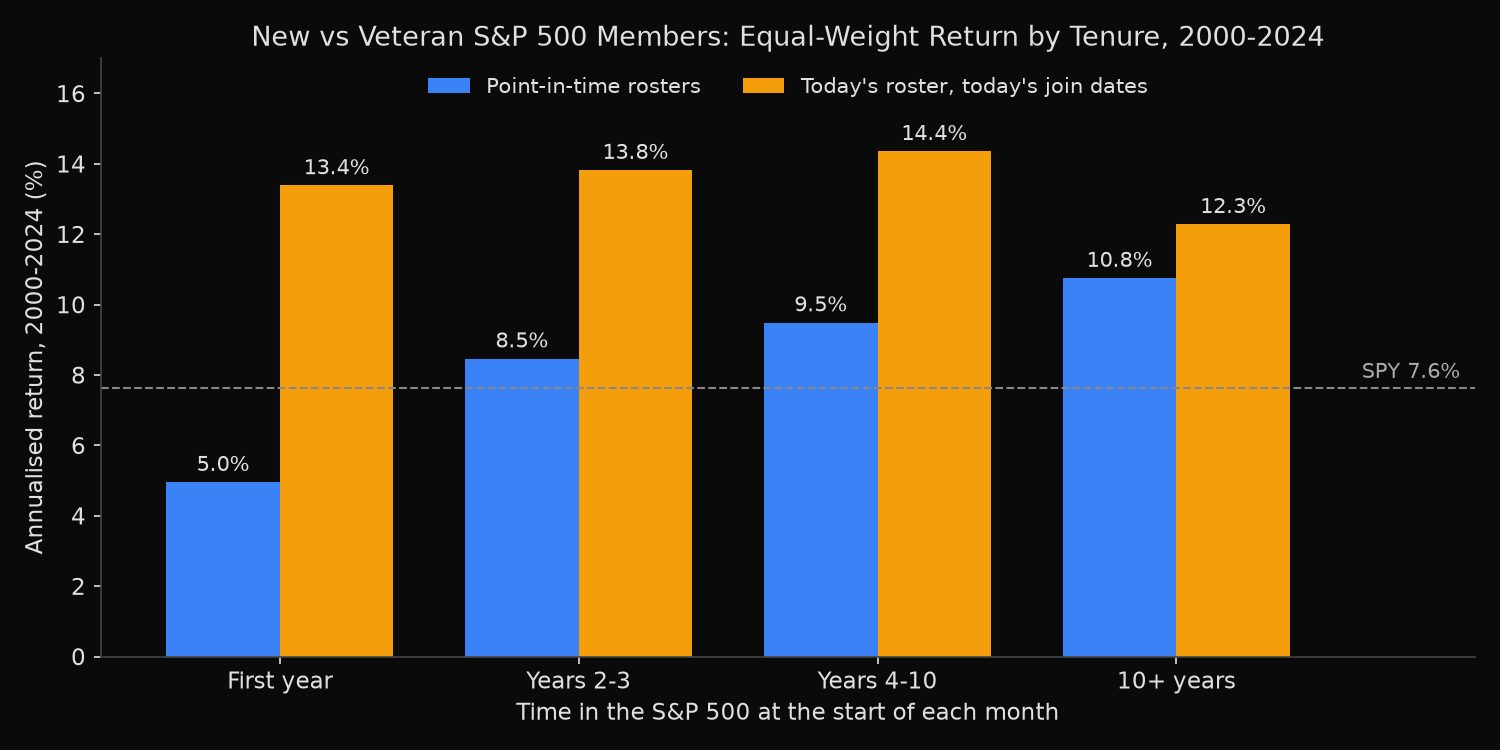
Companies in their first year in the S&P 500 returned 4.95% a year from 2000 to 2024, held equal-weight from the roster in force each month, while members of more than ten years returned 10.75%. Rebuilt from today’s list and its join dates, the order reverses: first-year members return 13.38% a year and veterans 12.28%.
Do companies joining the S&P 500 keep up with long-standing members?
This question concerns the years after a company joins, not the trading days around inclusion, which an event study of the S&P 500 index effect covers. Jeremy Siegel and Jeremy Schwartz, in the Financial Analysts Journal in 2006, found that the original 1957 members, bought and held, beat the continually updated index, which suggests later arrivals may lag.
Tenure means the years since the start of a company’s current membership. Measuring returns by tenure needs the companies that joined and later left, with join dates as they stood; today’s list keeps only additions still in the index, the plainest form of survivorship bias.
Sorting 300 monthly rosters by years in the index
- On each month-end trading day from December 1999 to November 2024, draw the roster in force with
xfl.index("sp500", as_of=...), described in the index membership reference. Each row’sadded_datestarts the member’s current spell, so the 26 securities re-added within the period start again at zero, as the committee treats them as new additions. - Split each roster into four tenure buckets (first year, years 2-3, years 4-10, more than 10 years) and hold each equal-weight the next month on monthly total returns. A member whose last day in the index is the formation date is not held (103 member-months); a recorded delisting return is added in the exit month (430 exits); a member with no return in the holding month drops out of that month (9 member-months).
- Compare each bucket with SPY, dividends included, and take the monthly first-year minus 10+ spread with its t-statistic.
- Repeat on today’s roster (3 November 2026), counting each member from its current join date.
- As a cross-check, follow every addition from 2000 to 2021 for 12 and 36 months after its join month, in the index or not. Each is compared with SPY over the same months, through its last return month if it stopped trading sooner; windows with a gap in monthly returns are left out.
Code
import numpy as np
import pandas as pd
import xfinlink as xfl

xfl.set_api_key("YOUR_API_KEY")  # free at https://xfinlink.com/signup

# Month-end trading days and SPY's monthly total return
spy = xfl.prices("SPY", start="1999-12-01", end="2024-12-31", fields=["return_daily"])
spy["date"] = pd.to_datetime(spy["date"])
month_ends = spy.groupby(spy["date"].dt.to_period("M"))["date"].max()
spy_m = spy.groupby(spy["date"].dt.to_period("M"))["return_daily"].apply(
    lambda r: (1 + r.fillna(0)).prod() - 1)
formation = month_ends.loc[:"2024-11"]

# The roster in force at each month end; added_date starts each member's current spell
pit = pd.concat([xfl.index("sp500", as_of=d.strftime("%Y-%m-%d")).dropna(subset=["entity_id"])
                 .assign(month=m, asof=d) for m, d in formation.items()])
today = xfl.index("sp500").dropna(subset=["entity_id"])
for f in (pit, today):
    f["entity_id"] = f["entity_id"].astype(int)
    f["added_date"] = pd.to_datetime(f["added_date"])
pit = pit[pd.to_datetime(pit["removed_date"]) != pit["asof"]]   # leaving on the formation date
surv = pd.concat([today[today["added_date"] <= d].assign(month=m, asof=d)
                  for m, d in formation.items()])               # survivor-only version

# Monthly total returns by entity id, with recorded delisting returns in the exit month
ids = sorted(set(pit.entity_id) | set(today.entity_id))
parts, exits = [], {}
for i in range(0, len(ids), 16):   # 16 ids fit on one 5,000-row page, so no page's exits are lost
    p = xfl.prices(entity_id=ids[i:i + 16], start="1999-11-01", end="2024-12-31",
                   interval="1mo", fields=["return_daily"], max_rows=100_000)
    assert len(p) < 5000
    parts.append(p)
    exits.update(p.attrs.get("meta", {}).get("delisting", {}) or {})
px = pd.concat(parts)
ret = px.assign(month=px["date"].dt.to_period("M")).pivot_table(
    index="month", columns="entity_id", values="return_daily", aggfunc="first")
for eid, ev in exits.items():
    eid, dl, m = int(eid), ev.get("delisting_return"), pd.Period(ev["event_date"], "M")
    if dl is not None and eid in ret.columns and m in ret.index:
        r0 = ret.at[m, eid]
        ret.at[m, eid] = (1 + (0 if pd.isna(r0) else r0)) * (1 + dl) - 1

# Tenure buckets at each month end, held equal-weight the next month
bins, labels = [0, 1, 3, 10, np.inf], ["first year", "years 2-3", "years 4-10", "10+ years"]
def bucket_returns(book):
    b = book.assign(hold=book["month"] + 1,
                    tenure=(book["asof"] - book["added_date"]).dt.days / 365.25)
    b["bucket"] = pd.cut(b["tenure"], bins, right=False, labels=labels)
    b["r"] = ret.stack().reindex(pd.MultiIndex.from_arrays([b["hold"], b["entity_id"]])).to_numpy()
    return b.dropna(subset=["r"]).groupby(["hold", "bucket"], observed=True)["r"].mean().unstack()

for name, book in [("point-in-time", pit), ("today's roster", surv)]:
    out = bucket_returns(book)
    ann = (1 + out).prod() ** (12 / len(out)) - 1
    spread = out["first year"] - out["10+ years"]
    t = spread.mean() / spread.std() * np.sqrt(len(spread))
    print(name, ann.round(4).to_dict(), f"spread {spread.mean() * 1200:+.2f} t={t:.2f}")

# Cross-check: each addition 2000-2021, 12 and 36 months after its join month, minus SPY over
# the same months (through the stock's last return month); windows with a gap are left out
def forward(eid, start, n):
    win = pd.period_range(start + 1, periods=n, freq="M")
    r = ret[eid].reindex(win)
    last = r.last_valid_index()
    if last is None or r.loc[:last].isna().any():
        return np.nan, np.nan
    return (1 + r.loc[:last]).prod() - 1, (1 + spy_m.loc[win[0]:last]).prod() - 1

for name, book in [("point-in-time", pit), ("today's roster", today)]:
    adds = book.drop_duplicates(["entity_id", "added_date"])
    adds = adds[adds["added_date"].between("2000-01-01", "2021-12-31")]
    for n in (12, 36):
        ex = pd.Series([np.subtract(*forward(e, pd.Period(a, "M"), n))
                        for e, a in zip(adds["entity_id"], adds["added_date"])]).dropna()
        print(name, n, len(ex), f"median {ex.median():.1%}", f"beat SPY {(ex > 0).mean():.1%}")
Full script with formatting and visualisation: sp500-new-members-vs-veterans-returns-python.py
Output
300 month ends, 1098 securities, holding months 2000-01 to 2024-12
Member-months held: 150,409; not held because the member left on the formation date: 103; no return in the holding month: 9; recorded delisting returns applied: 430
Securities re-added after an earlier spell (tenure restarts): 26

Point-in-time rosters: average members per month first year 24, years 2-3 48, years 4-10 131, 10+ years 298
             % a year  volatility %  months beating SPY %  excess vs SPY % a year  t-stat
first year       4.95         20.71                 49.00                   -1.52   -0.73
years 2-3        8.46         21.49                 52.33                    1.96    0.96
years 4-10       9.49         18.96                 52.00                    2.37    1.67
10+ years       10.75         16.71                 56.00                    3.13    2.60
all members      9.80         17.68                 52.67                    2.43    2.11

Today's roster, today's join dates: average members per month first year 11, years 2-3 22, years 4-10 69, 10+ years 201
             % a year  volatility %  months beating SPY %  excess vs SPY % a year  t-stat
first year      13.38         20.05                 53.33                    6.10    2.49
years 2-3       13.82         19.54                 59.00                    6.40    3.34
years 4-10      14.36         17.54                 60.33                    6.49    5.02
10+ years       12.28         15.63                 60.00                    4.33    3.89
all members     12.93         16.10                 63.67                    4.99    4.77

Spread: first year minus 10+ years, equal weight
  Point-in-time rosters: -4.65 points a year, t-stat -1.95, first year ahead in 48% of 300 months
  Today's roster, today's join dates: +1.77 points a year, t-stat 0.71, first year ahead in 55% of 300 months
  by five-year period, points a year:
                Point-in-time rosters  Today's roster, today's join dates
holding months
2000-2004                       -8.56                               10.54
2005-2009                       -6.48                               -6.19
2010-2014                       -1.89                                1.51
2015-2019                       -3.99                                2.76
2020-2024                       -2.31                                0.22
SPY: 7.62% a year

Additions 2000-2021: return from the end of the join month, minus SPY over the same months
(through the stock's last return month when it stopped trading sooner)
                                              additions  left out (gap)  median excess %  mean excess %  beat SPY %
group                              horizon
Additions on point-in-time rosters 12 months        544               0             -4.6           -2.3        43.6
                                   36 months        544               1             -6.7           -3.0        45.3
Additions still in today's roster  12 months        242               0             -1.9            2.7        47.9
                                   36 months        242               0              9.3           11.4        55.4

Additions 2000-2021 no longer in today's roster, gap-free windows: 292; five largest 36-month losses
ticker          entity_name      added  36-month return %
   MIR          MIRANT CORP 2001-04-03              -99.1
  PALM             PALM INC 2000-07-28              -97.9
  BVSN      BROADVISION INC 2000-11-06              -97.7
  JDSU  J D S UNIPHASE CORP 2000-07-27              -97.5
  CNXT CONEXANT SYSTEMS INC 2000-01-31              -96.3
Newcomers trailed veterans on the dated rosters in every five-year stretch
On the dated rosters, return rises with tenure at every step, from 4.95% a year in the first year to 10.75% after ten years. The first-year bucket is the only one behind SPY, and more volatile than veterans, 20.71% against 16.71%. The newcomer spread of -4.65 points a year has a t-statistic of -1.95, close to the 5% threshold on its own, but it is negative in all five five-year periods, from -8.56 points in 2000-2004 to -1.89 in 2010-2014. Followed one by one, the median addition trailed SPY by 4.6 percentage points over 12 months and 6.7 over 36.
Today’s roster puts first-year members 1.77 points a year ahead of veterans, and its additions beat SPY by a median 9.3 percentage points over 36 months.
The distortion lands on newcomers. Switching to today’s list lifts the first-year bucket by 8.43 points a year and the 10+ bucket by 1.53. The survivor version holds 11 first-year members a month against 24, but two in three veterans (201 of 298). The missing newcomers are additions later removed, acquired or failed: Mirant lost 99.1% in the 36 months after joining in April 2001, and Palm 97.9% after joining in July 2000.
What a tenure signal needs before it reaches a backtest
On the dated rosters, buying new S&P 500 members and holding them through their first year has trailed both SPY and the index’s own veterans since 2000.
Because the survivor-only test reverses the newcomer spread, any signal built on time since inclusion has to be measured on the roster in force at each date. The historical S&P 500 constituents lookup lists the members on any past date, and a survival analysis of S&P 500 membership length examines how exit risk changes with years served.
The all-member portfolio itself beat SPY by 2.43 points a year, so part of the veterans’ 3.13-point excess is shared by every equal-weighted member portfolio; comparing buckets with one another removes it.
Built with xfinlink — free financial data API for Python.