
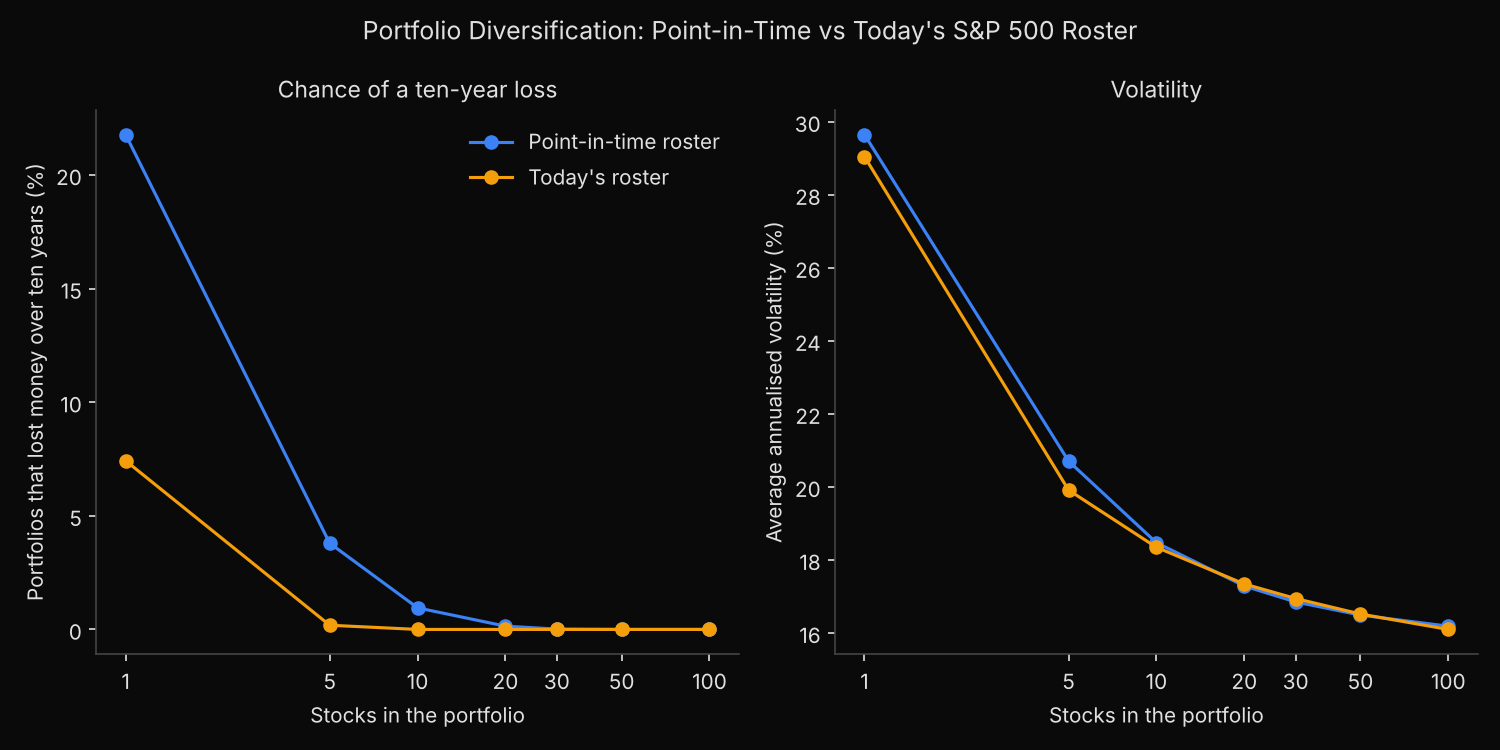
Survivorship bias leaves the volatility curve intact and hides the losses underneath it. Of random five-stock portfolios drawn from the S&P 500 as it stood at each year end from 1999 to 2014 and held for ten years, 3.79% ended the decade below their starting value; drawn from today’s roster, 0.18% did. Average volatility falls from about 29% to 30% for a single stock to about 18% for ten on either list, so a survivor-roster test answers the volatility question correctly while making small portfolios look almost incapable of losing money.
Does the classic diversification answer depend on the roster?
The standard test of how many stocks a portfolio needs draws random portfolios of growing size and measures their risk. Volatility shrinks quickly as stocks are added, then flattens once the risk specific to each company has averaged out and only market risk remains. An earlier random-portfolio simulation on the current roster, with daily data, covers the same question.
The weak point is the universe. Sampling from today’s S&P 500 list rules out every company that collapsed, was sold cheaply or shrank out of the index during the test: survivorship bias in a backtest, applied here to risk rather than to return. The question is which risk measures the survivor list distorts.
Drawing 448,000 random portfolios from two rosters
- Take the S&P 500 roster on the last business day of each year from 1999 to 2014 with
xfl.index("sp500", as_of=...)(see the index membership reference): about 500 members each, including companies that later left. - For the same dates, build the survivor universe: today’s members already trading, 393 on average.
- Pull monthly total returns for the 1,038 securities, 2000 to 2024.
- For each start date, universe and size (1 to 100 stocks), draw 2,000 random equal-weight portfolios and hold them ten years without rebalancing. A holding that stops trading is sold at its last close, with the proceeds going to the remaining stocks, or to cash when none remain.
The last window runs from 2015 to 2024, and a fixed random seed makes the output reproducible.
Code
import numpy as np
import pandas as pd
import xfinlink as xfl

xfl.set_api_key("YOUR_API_KEY")  # free at https://xfinlink.com/signup

SIZES, DRAWS, H = [1, 5, 10, 20, 30, 50, 100], 2000, 120  # H: ten years of months
starts = pd.date_range("1999-12-01", "2014-12-31", freq="BYE")  # last business day of each year
pit = {d.year: xfl.index("sp500", as_of=d.strftime("%Y-%m-%d")).entity_id.dropna().astype(int).tolist()
       for d in starts}
today = set(xfl.index("sp500").entity_id.dropna().astype(int))

ids = sorted(set().union(*pit.values()) | today)
px = pd.concat(xfl.prices(entity_id=ids[i:i + 25], start="2000-01-01", end="2024-12-31", interval="1mo",
                          fields=["return_daily"], max_rows=100_000) for i in range(0, len(ids), 25))
ret = px.assign(month=px["date"].dt.to_period("M")).pivot(index="month", columns="entity_id",
                                                           values="return_daily")

def hold(R):
    """Buy and hold equal weights. R: (portfolios, months, stocks), NaN once a stock stops trading."""
    v, cash = np.full((R.shape[0], R.shape[2]), 1 / R.shape[2]), np.zeros(R.shape[0])
    alive, monthly = np.ones(v.shape, bool), []
    for t in range(R.shape[1]):
        r = R[:, t, :]
        alive &= ~np.isnan(r)
        gone = np.where(alive, 0, v).sum(1)
        v = np.where(alive, v, 0)
        left = v.sum(1)
        v = v * np.where(left > 0, (left + gone) / np.where(left > 0, left, 1), 1)[:, None]
        cash = cash + np.where(left > 0, 0, gone)
        before = v.sum(1) + cash
        v = v * (1 + np.nan_to_num(r))
        monthly.append((v.sum(1) + cash) / before - 1)
    return v.sum(1) + cash, np.array(monthly).T

rng, rows = np.random.default_rng(7), []
for year, members in pit.items():
    window = ret.loc[pd.Period(f"{year + 1}-01", "M"):].iloc[:H]
    trading = window.columns[window.iloc[0].notna()]
    universes = {"Point-in-time roster": [e for e in members if e in trading],
                 "Today's roster": [e for e in trading if e in today]}
    for name, u in universes.items():
        A = window[u].to_numpy()
        for n in SIZES:
            picks = np.array([rng.choice(len(u), n, replace=False) for _ in range(DRAWS)])
            wealth, monthly = hold(A[:, picks].transpose(1, 0, 2))
            rows.append(pd.DataFrame({"start": year, "roster": name, "n": n, "pool": len(u), "wealth": wealth,
                                      "vol": monthly.std(axis=1) * np.sqrt(12)}))
sims = pd.concat(rows)
sims["annual"] = sims["wealth"] ** (1 / 10) - 1

summary = sims.groupby(["n", "roster"]).agg(
    lost_money=("wealth", lambda w: (w < 1).mean()),
    median_annual=("annual", "median"),
    worst_5pct_annual=("annual", lambda a: a.quantile(0.05)),
    volatility=("vol", "mean")).unstack("roster")
print(summary)
Full script with formatting and visualisation: how-many-stocks-to-diversify-survivorship-bias-python.py
Output
16 start dates, 1038 securities, 448,000 simulated portfolios
roster
Point-in-time roster    500.0
Today's roster          393.0

                 lost_money                       median_annual                   worst_5pct_annual                          volatility
roster Point-in-time roster Today's roster Point-in-time roster Today's roster Point-in-time roster Today's roster Point-in-time roster Today's roster
n
1                    21.77%          7.42%                6.96%         11.83%              -16.49%         -2.26%               29.64%         29.04%
5                     3.79%          0.18%                9.62%         13.73%                0.85%          6.32%               20.71%         19.91%
10                    0.95%          0.00%                9.87%         14.34%                3.10%          8.00%               18.47%         18.34%
20                    0.14%          0.00%               10.02%         14.84%                4.35%          9.25%               17.28%         17.34%
30                    0.02%          0.00%               10.08%         15.11%                4.80%          9.79%               16.85%         16.94%
50                    0.00%          0.00%               10.07%         15.26%                5.26%         10.44%               16.49%         16.52%
100                   0.00%          0.00%               10.05%         15.37%                5.63%         11.08%               16.18%         16.09%

Five-stock portfolios that lost money over ten years, by start year
roster  Point-in-time roster  Today's roster
start
1999                   14.9%            1.6%
2000                   11.8%            0.7%
2001                   13.1%            0.5%
2002                    3.8%            0.0%
2003                    1.8%            0.0%
2004                    1.8%            0.0%
2005                    3.6%            0.0%
2006                    2.8%            0.1%
2007                    1.5%            0.1%
2008                    0.2%            0.0%
2009                    0.5%            0.0%
2010                    1.1%            0.0%
2011                    0.2%            0.0%
2012                    0.7%            0.0%
2013                    1.2%            0.0%
2014                    1.6%            0.1%

Point-in-time members held alone for ten years: 7,995, lost money 21.5%, lost 90% or more 3.5%
Lost money: {'no longer in index': '33.7%', 'still in index': '9.5%'}
Share of the losers no longer in the index today: 77.9%
Survivors leave volatility alone and erase the losses
The volatility columns barely differ: 29.64% against 29.04% for one stock, 18.47% against 18.34% for ten, 16.18% against 16.09% for 100. Volatility measures how far monthly returns scatter, not whether they add up to a gain, and the two lists produce almost the same monthly scatter. On either list most of the reduction is complete by 20 to 30 stocks.
The loss columns part company at every small size. A single stock lost money over ten years 21.77% of the time on the dated rosters against 7.42% on today’s, five stocks 3.79% against 0.18%, and ten stocks 0.95% against a share that rounds to zero. The worst 5% of ten-stock portfolios returned 3.10% a year on the dated rosters and 8.00% on today’s. The last three lines show where the gap comes from: of 7,995 ten-year holdings of single members, 21.5% lost money, and 77.9% of those losers are no longer in the index. Members that later left lost money 33.7% of the time; members still in the index, 9.5%.
On the dated rosters, 14.9% of five-stock portfolios bought at the end of 1999 lost money over a decade that held two bear markets, while every start from 2002 onward stayed between 0.2% and 3.8%; on today’s roster the rate never passed 1.6%.
How many stocks to hold, and which list to test on
For volatility, the survivor list gives the right answer: 20 to 30 equal-weight S&P 500 stocks capture most of the reduction, and moving from 30 to 100 lowers average volatility by less than one point. For the risk a holder of a small portfolio actually feels, ending a decade with less money, today’s roster understates it about threefold for a single stock and about twentyfold for five stocks.
A concentration limit or diversification study built on loss probabilities belongs on rosters as they stood, such as the S&P 500 members on any past date; a volatility check cannot catch the problem, since both lists pass it. How much of the index changes over horizons this long is covered in the study of how many S&P 500 members stay in the index for 20 years.
Built with xfinlink — free financial data API for Python.