
Counted on today’s S&P 500 list, the share of members trading above their 200-day moving average reads 4.4 points higher than it did on the index as it stood, on average across 301 month ends from December 1999 to December 2024, and 15.5 points higher in July 2000. A rule that held SPY only while breadth stood at 50% or more was invested in 16 extra months on the survivor version, months in which SPY averaged -0.85%, and returned 5.71% a year against 6.38% on point-in-time rosters, with a worst drawdown of 39.0% against 34.0%.
Why would a breadth chart drawn from today’s members read high?
Market breadth measures how many stocks take part in a move. A widely followed version is the percentage of an index’s members whose price sits above its 200-day moving average, the mean close of the latest 200 sessions, that day included. Readings above 50% are taken as a healthy market and readings under 20% as a washout, and some timing rules move between stocks and cash on the 50% line.
Rebuilding that history needs the members on each past date. Today’s list is the easy substitute, and it carries survivorship bias, the error set out in the guide to survivorship bias in backtesting. It drops companies that were members and later left, and it counts companies that joined later; the measurements below show which way each pushes the reading.
Counting members above their averages at 301 month ends
- Take the last trading day of each month from December 1999 to December 2024 and draw the S&P 500 roster in force that day with
xfl.index("sp500", as_of=...); the index membership reference documentsas_of. - Pull daily split-adjusted closes from January 1999 for the 1,100 securities involved, keyed by entity id, and compute each one’s 200-day simple moving average.
- On each month end, measure the share of members above their average. A member counts when it has a close that day and at least 200 closes behind it: 499 of 502 on an average roster.
- Repeat on today’s roster (1 November 2026), counting the members already trading with 200 closes on each date, 420 on average, and on each past roster less the companies that have since left.
- Hold SPY, dividends included, in each month after a reading of 50% or more and cash earning nothing after a lower one, once for each version of the indicator.
Code
import pandas as pd
import xfinlink as xfl

xfl.set_api_key("YOUR_API_KEY")  # free at https://xfinlink.com/signup

# Month-end trading days, taken from SPY's own sessions
spy = xfl.prices("SPY", start="1999-12-01", end="2024-12-31", fields=["return_daily"])
spy["date"] = pd.to_datetime(spy["date"])
month_ends = spy.groupby(spy["date"].dt.to_period("M"))["date"].max()

# The roster in force on each month end, and today's roster
pit = {d: set(xfl.index("sp500", as_of=d.strftime("%Y-%m-%d")).entity_id.dropna().astype(int))
       for d in month_ends}
today = set(xfl.index("sp500").entity_id.dropna().astype(int))

# Split-adjusted closes and each security's 200-day simple moving average
ids = sorted(set().union(*pit.values()) | today)
px = pd.concat(xfl.prices(entity_id=ids[i:i + 25], start="1999-01-01", end="2024-12-31",
                          fields=["adj_close"], max_rows=250_000) for i in range(0, len(ids), 25))
px = px.dropna(subset=["adj_close"]).astype({"entity_id": int})
px["date"] = pd.to_datetime(px["date"])
px = px.sort_values(["entity_id", "date"]).drop_duplicates(["entity_id", "date"])
px["ma200"] = px.groupby("entity_id")["adj_close"].transform(lambda s: s.rolling(200).mean())
obs = px[px["date"].isin(set(month_ends)) & px["ma200"].notna()]
above = obs.assign(up=obs["adj_close"] > obs["ma200"]).set_index(["date", "entity_id"])["up"]

def breadth(d, universe):
    a = above.loc[d]
    return a[a.index.isin(universe)].mean() * 100

b = pd.DataFrame({"point_in_time": [breadth(d, pit[d]) for d in month_ends],
                  "todays_roster": [breadth(d, today) for d in month_ends],
                  "still_members": [breadth(d, pit[d] & today) for d in month_ends]},
                 index=month_ends.values)

# Timing rule: a reading of 50% or more at a month end holds SPY the next month
spy_m = spy.set_index("date")["return_daily"].fillna(0).groupby(pd.Grouper(freq="ME")).apply(
    lambda r: (1 + r).prod() - 1)
spy_m.index = spy_m.index.to_period("M")
sig = (b[["point_in_time", "todays_roster"]] >= 50).astype(int)
sig.index = sig.index.to_period("M") + 1
sig = sig.loc[sig.index <= spy_m.index[-1]]
growth = (1 + sig.mul(spy_m.reindex(sig.index), axis=0)).cumprod()

print(b.mean().round(1))
print((growth.iloc[-1] ** (12 / len(sig)) - 1).mul(100).round(2))
Full script with formatting and visualisation: market-breadth-200-day-survivorship-bias-python.py
Output
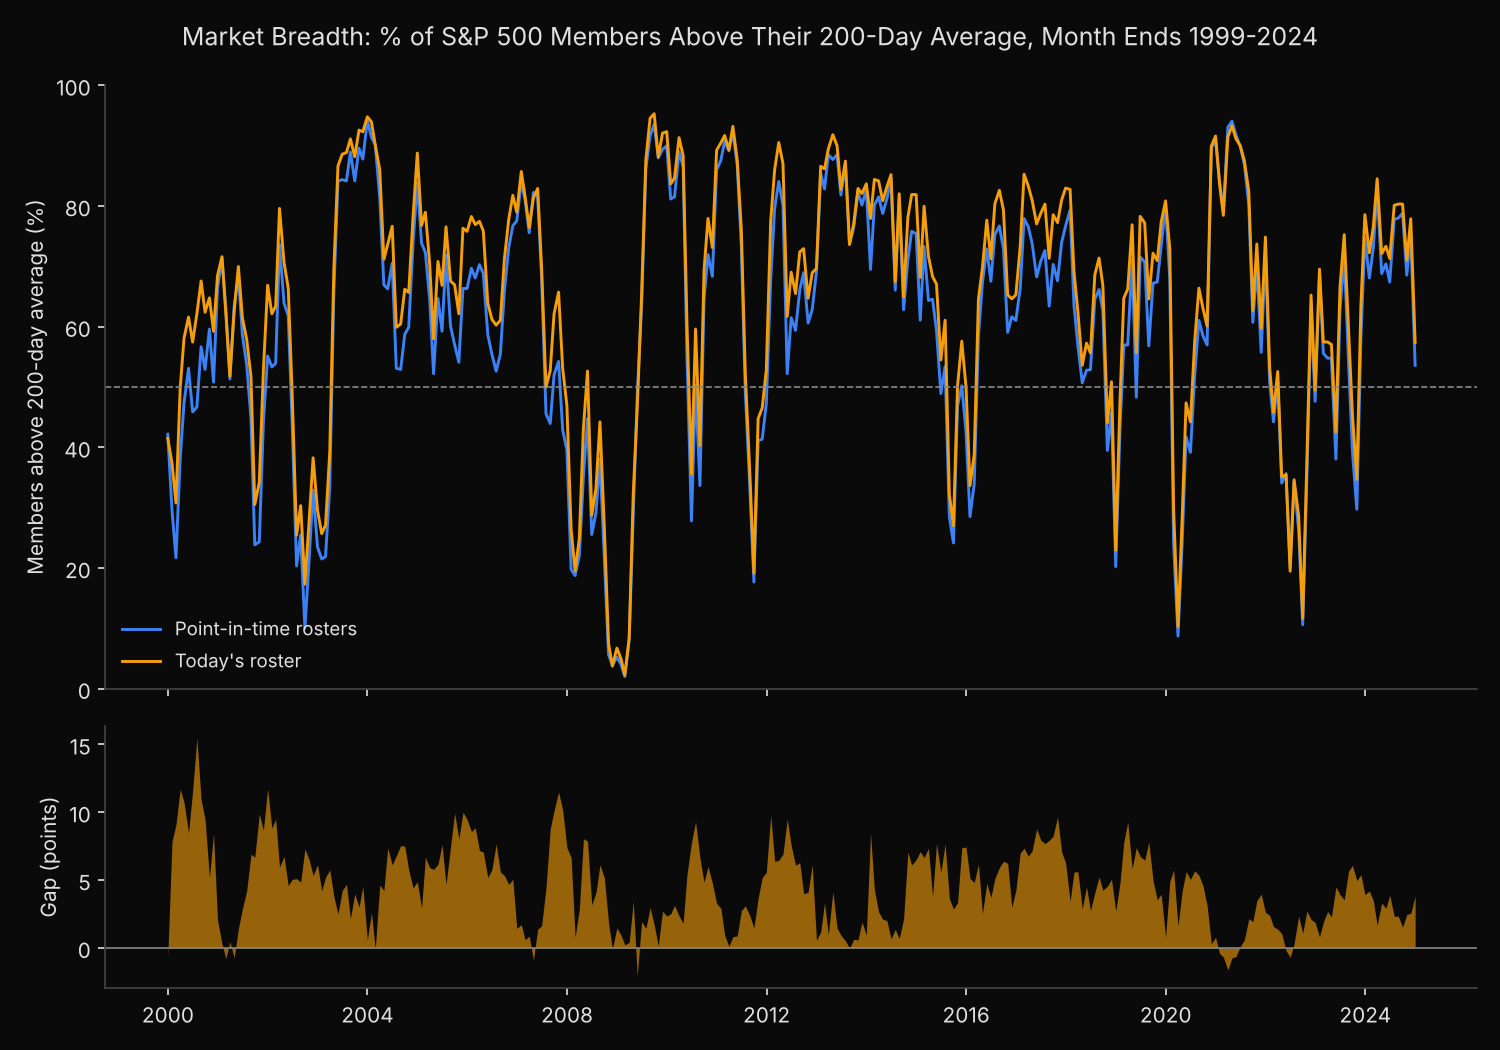
301 month ends, 1100 securities; members counted per month: point-in-time 499 of 502, today's roster 420

Share of members above their 200-day average (%), monthly averages
                       point_in_time  todays_roster  still_members  gap
Dec 1999 - Dec 2024             60.2           64.6           63.1  4.4
2000-2002 bear market           46.5           53.2           49.6  6.6
2007-2009 crisis                23.4           27.7           24.5  4.4
2010-2019                       65.8           70.4           69.2  4.7
2020-2024                       59.2           61.7           60.9  2.6

Readings on selected month ends (%)
         point_in_time  todays_roster   gap
date
2000-03           38.2           49.8  11.7
2002-09           10.0           17.3   7.3
2007-10           54.2           65.7  11.5
2008-11            3.8            3.7  -0.1
2009-02            2.0            2.2   0.2
2011-09           17.7           19.1   1.5
2015-08           28.5           32.1   3.6
2018-12           20.2           22.9   2.7
2020-03            8.7           10.3   1.6
2022-09           10.6           11.7   1.1
2024-12           53.6           57.4   3.8

Gap (today's roster minus point-in-time): min -2.1 (2009-05), max 15.5 (2000-07); months with gap above 10 points: 9 of 301

Months in each zone
               below 20% (washout)  below 50%  above 80%
point_in_time                   12         79         60
todays_roster                   12         63         77

Timing rule, 2000-01 to 2024-12: hold SPY next month when breadth >= 50%
                  % a year  max drawdown %  months invested
point_in_time         6.38          -33.97              221
todays_roster         5.71          -39.02              237
SPY buy and hold      7.62          -50.80              300

Months the two signals disagree: 16; in 16 of them only today's roster says invest. SPY in those months: mean -0.85%
  2000-05 (-1.6%), 2000-07 (-1.6%), 2000-08 (+6.6%), 2001-09 (-8.2%), 2001-12 (+0.6%), 2007-08 (+1.3%), 2007-09 (+3.9%), 2007-12 (-1.1%), 2008-06 (-8.3%), 2011-08 (-5.5%), 2012-01 (+4.6%), 2015-07 (+2.3%), 2015-11 (+0.4%), 2016-01 (-5.0%), 2018-12 (-8.8%), 2019-06 (+7.0%)
The survivor reading ran high going into both bear markets
The error is largest where the index changed most. Over 2000 to 2002 today’s members averaged 53.2% above their 200-day lines against 46.5% for the real rosters, which moves the average reading of that bear market from below the 50% line to above it. At the October 2007 peak the index as it stood read 54.2%, barely past the line; today’s members read 65.7%, well clear of it.
Most of the gap comes from removals. Each past roster without the companies that later left averages 63.1%, 2.9 points above the full roster, and companies that joined afterwards supply the other 1.5. The lower panel of the chart keeps the gap above zero for most of the 25 years, with a low of -2.1 points in May 2009.
At the deepest readings the bias fades. Both versions read under 4% in November 2008 and February 2009, and both count 12 washout months under 20%: when nearly every stock is below its average, the choice of list matters little. The mid-range is another matter, since that is where a 50% rule decides. Today’s roster shows 63 months below the line against 79, and 77 months above 80% against 60.
Those 16 months are where the two timing rules part, and in every one the survivor version holds SPY while the real one holds cash. Eight of them lost money, among them September 2001 (-8.2%), June 2008 (-8.3%), August 2011 (-5.5%) and December 2018 (-8.8%). The extra exposure cost 0.67 points a year and about 5 points of worst drawdown. Neither version beat holding SPY throughout, at 7.62% a year, although both kept well clear of its 50.8% drawdown.
Testing a breadth rule on the members of each date
A breadth threshold set on today’s members is set on a market that looked healthier than the one investors traded. Rebuild the indicator from the roster in force on each date before reading anything into its history; the error falls below 2 points in most washout months, though it was 7.3 points in September 2002, and reaches 11 to 16 points around the 2000 and 2007 peaks, the readings that decide when a timing rule leaves the market. The same check applies to any breadth history computed from current members.
Month-end rosters were exact here because the indicator is read once a month. A rule read daily needs daily membership, and a measurement of how far S&P 500 rosters drift between refreshes covers how often to pull them. The historical S&P 500 constituents lookup lists the members on any past date, companies that later left the index included.
Built with xfinlink — free financial data API for Python.