
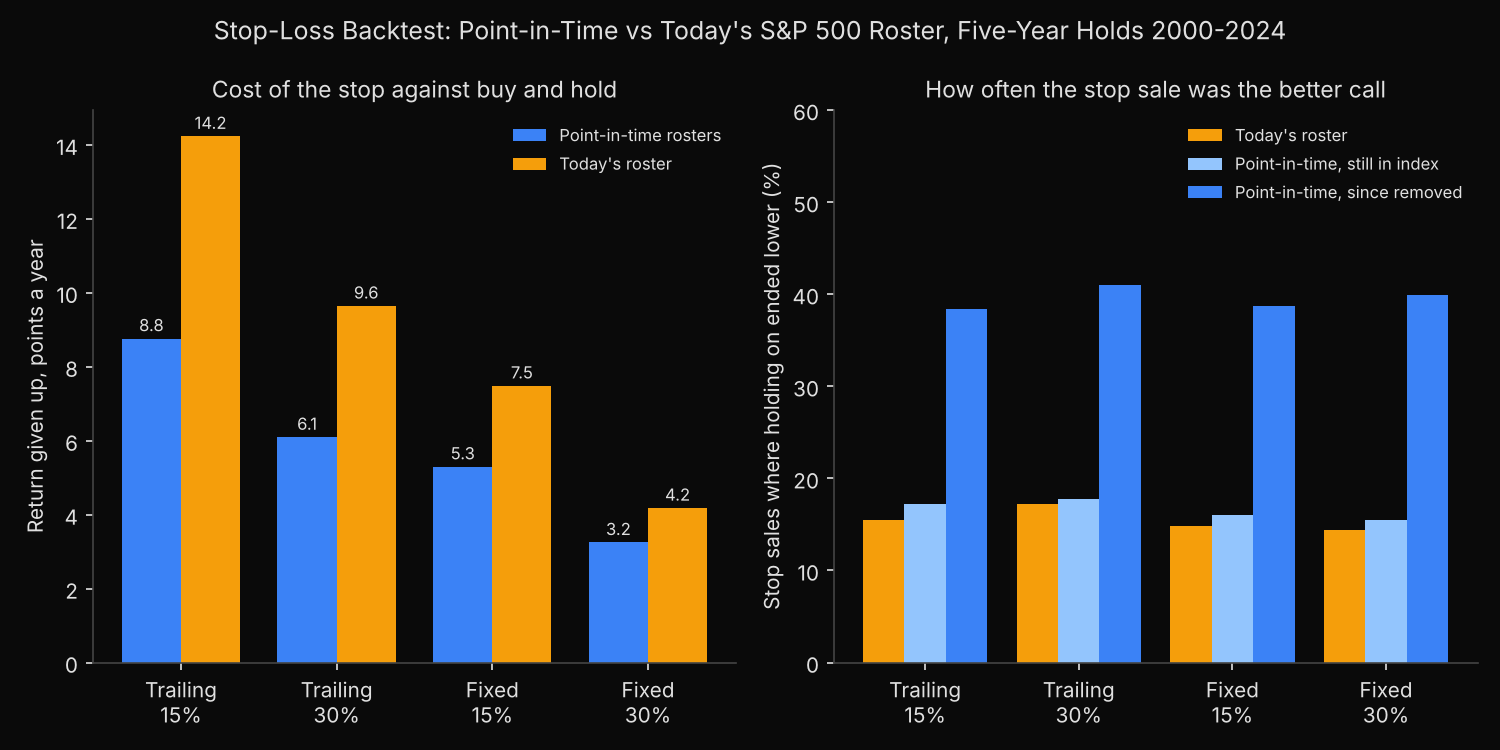
A stop-loss still loses money in an S&P 500 backtest run on the index as it stood, but today’s roster overstates the bill by 29% to 62%. Over five-year holds started at each year end from 1999 to 2019, a 30% trailing stop gave up 6.09 points of annual return on point-in-time rosters and 9.64 points on today’s list. On the dated rosters, holding on ended below the sale price after 28% of the stop’s sales; on today’s list, after 17%.
Does today’s roster make every stop look like a mistake?
A stop-loss sells a holding once it falls a set distance: from the purchase price for a fixed stop, from the highest value since purchase for a trailing stop. Its case rests on the holdings that fall and keep falling.
Today’s S&P 500 list is a poor place to find those. Every company on it survived, so a test drawn from it leaves out the crashes that ended in failure, and more of its stop sales look like a premium paid for nothing. That is survivorship bias in a backtest, applied to an exit rule. An earlier trailing-stop backtest on a sample of the 2015 roster prices the rule over one decade; this test asks how far the choice of roster moves the verdict.
Buying every member at 21 year ends, with and without a stop
- Take the S&P 500 roster on the last business day of each year from 1999 to 2019 with
xfl.index("sp500", as_of=...)(see the index membership reference), companies that later left included. - For the same dates, build the survivor universe: today’s members already trading, 410 on average.
- Pull daily total returns for the 1,078 securities, 2000 to 2024, keyed by entity id.
- Hold every stock for five years, and compare buy and hold with four stops checked on each daily close: trailing 15% and 30% below the peak, fixed 15% and 30% below the purchase price. A stopped position sits in cash earning nothing.
- A holding that stops trading for 20 sessions is sold at its last close, with or without a stop.
A stop’s cost is the gap in annualised five-year return, in percentage points, between equal-weight baskets of the same stocks, held and stopped, averaged over the 21 start dates. Trading costs and taxes are left out.
Code
from concurrent.futures import ThreadPoolExecutor

import numpy as np
import pandas as pd
import xfinlink as xfl

xfl.set_api_key("YOUR_API_KEY")  # free at https://xfinlink.com/signup

H, GAP = 5, 20  # five-year holds; 20 sessions without a return ends a holding
RULES = {"Trailing 15%": ("trailing", 0.15), "Trailing 30%": ("trailing", 0.30),
         "Fixed 15%": ("fixed", 0.15), "Fixed 30%": ("fixed", 0.30)}
starts = pd.date_range("1999-12-01", "2019-12-31", freq="BYE")  # last business day of each year
pit = {d.year: xfl.index("sp500", as_of=d.strftime("%Y-%m-%d")).entity_id.dropna().astype(int).tolist()
       for d in starts}
today = set(xfl.index("sp500").entity_id.dropna().astype(int))

ids = sorted(set().union(*pit.values()) | today)
def fetch(i):
    return xfl.prices(entity_id=ids[i:i + 25], start="2000-01-01", end="2024-12-31",
                      fields=["return_daily"], max_rows=250_000)
with ThreadPoolExecutor(8) as pool:
    chunks = list(pool.map(fetch, range(0, len(ids), 25)))
px = pd.concat(chunks)
ret = px.pivot_table(index="date", columns="entity_id", values="return_daily", aggfunc="first").sort_index()

def held_path(r):
    """Total-return index from the first day of the window to the last close before a 20-session gap."""
    missing = np.isnan(r)
    run = np.convolve(missing, np.ones(GAP, int), "valid")  # missing sessions in each 20-session stretch
    end = np.flatnonzero(run == GAP)[0] if (run == GAP).any() else len(r)
    return np.cumprod(1 + np.nan_to_num(r[:end])), end < len(r)

def with_stop(P, kind, k):
    """Value at the end of the window (1 = entry) and whether the stop sold."""
    peak = np.maximum.accumulate(np.maximum(P, 1.0)) if kind == "trailing" else np.ones_like(P)
    hit = np.flatnonzero(P <= (1 - k) * peak)
    return (P[hit[0]], True) if len(hit) else (P[-1], False)

rows = []
for year, members in pit.items():
    window = ret.loc[f"{year + 1}-01-01":f"{year + H}-12-31"]
    trading = set(window.columns[window.iloc[0].notna()])
    for roster, u in {"Point-in-time": [e for e in members if e in trading],
                      "Today's roster": sorted(today & trading)}.items():
        for e in u:
            P, stopped_trading = held_path(window[e].to_numpy())
            row = {"start": year, "roster": roster, "entity_id": e, "member_today": e in today,
                   "stopped_trading": stopped_trading, "hold": P[-1]}
            for name, (kind, k) in RULES.items():
                row[name], row[name + " sold"] = with_stop(P, kind, k)
            rows.append(row)
res = pd.DataFrame(rows)

def summary(g):
    basket = g.groupby("start")  # one equal-weight basket per start date
    annual = lambda col: basket[col].mean() ** (1 / H) - 1
    out = {"positions": len(g), "hold, % a year": annual("hold").mean() * 100}
    for name in RULES:
        sold = g[g[name + " sold"]]
        out[f"{name}: cost, pts a year"] = (annual("hold") - annual(name)).mean() * 100
        out[f"{name}: stop beats hold"] = (g[name] > g["hold"]).mean() * 100
        out[f"{name}: sales where holding ended lower"] = (sold["hold"] < sold[name]).mean() * 100
    return pd.Series(out)

pit_res = res[res["roster"] == "Point-in-time"]
groups = {"Point-in-time": pit_res,
          "  still in index": pit_res[pit_res["member_today"]],
          "  since removed": pit_res[~pit_res["member_today"]],
          "Today's roster": res[res["roster"] == "Today's roster"]}
table = pd.DataFrame({k: summary(g) for k, g in groups.items()})

# Where the gap comes from: five-year return given up per position, in points, split into
# members later removed (in the point-in-time roster only) and later additions (in today's only)
gaps = pd.DataFrame({k: {name: (g["hold"] - g[name]).mean() * 100 for name in RULES} for k, g in groups.items()})
gaps["removed members"] = gaps["  still in index"] - gaps["Point-in-time"]
gaps["later additions"] = gaps["Today's roster"] - gaps["  still in index"]
gaps["removed share"] = gaps["removed members"] / (gaps["Today's roster"] - gaps["Point-in-time"])

print(table.round(2))
print(gaps.round(3))
Full script with formatting and visualisation: stop-loss-backtest-survivorship-bias-python.py
Output
21 start dates, 1078 securities, 19,122 five-year holdings
roster
Point-in-time     501.0
Today's roster    410.0

Point-in-time holdings no longer in the index today: 44.2%; stopped trading inside the window: 12.9%

Cost of the stop, points of annual return
              Point-in-time    still in index    since removed  Today's roster
Trailing 15%           8.76             10.86             4.94           14.23
Trailing 30%           6.09              7.37             3.56            9.64
Fixed 15%              5.30              6.18             3.65            7.48
Fixed 30%              3.25              3.63             2.70            4.18

stop beats hold (%)
              Point-in-time    still in index    since removed  Today's roster
Trailing 15%          25.37             16.95            35.99           15.29
Trailing 30%          21.97             13.77            32.32           13.56
Fixed 15%             17.97              9.82            28.25            8.95
Fixed 30%             13.11              6.03            22.04            5.50

sales where holding ended lower (%)
              Point-in-time    still in index    since removed  Today's roster
Trailing 15%          26.35             17.24            38.37           15.50
Trailing 30%          28.14             17.78            40.98           17.25
Fixed 15%             27.02             16.02            38.66           14.86
Fixed 30%             28.38             15.47            39.87           14.39

Buy and hold, % a year: {'Point-in-time': 10.1, '  still in index': 12.51, '  since removed': 5.73, "Today's roster": 16.17}

Five-year return given up per position (points) and where the survivor roster's extra cost comes from
              Point-in-time  Today's roster  removed members  later additions  removed share
Trailing 15%           58.8           107.0             19.5             28.7          40.4%
Trailing 30%           41.7            76.9             14.2             21.0          40.4%
Fixed 15%              36.5            59.8              8.7             14.7          37.1%
Fixed 30%              22.3            33.5              4.0              7.2          35.9%

Examples (value of $1 after five years)
  Enron Corp                         from 1999  hold 0.014  Trailing 15% 1.356  Trailing 30% 1.393  Fixed 15% 0.840  Fixed 30% 0.697
  M C I Worldcom Inc                 from 1999  hold 0.005  Trailing 15% 0.802  Trailing 30% 0.683  Fixed 15% 0.802  Fixed 30% 0.683
  Lehman Brothers Holdings Inc       from 2003  hold 0.004  Trailing 15% 0.985  Trailing 30% 1.484  Fixed 15% 0.824  Fixed 30% 0.639
  Washington Mutual Inc              from 2003  hold 0.005  Trailing 15% 0.968  Trailing 30% 0.908  Fixed 15% 0.812  Fixed 30% 0.608
  American International Group Inc   from 2003  hold 0.025  Trailing 15% 0.908  Trailing 30% 0.773  Fixed 15% 0.828  Fixed 30% 0.698

With recorded delisting returns (442 records), cost of the stop in points of annual return:
              Point-in-time  Today's roster
Trailing 15%           8.77           14.23
Trailing 30%           6.10            9.64
Fixed 15%              5.30            7.48
Fixed 30%              3.25            4.18
Removed members are where the stops won most often
Every stop loses money on average on both lists. Buy and hold returned 10.10% a year on the point-in-time baskets and 16.17% on today’s, and the stops cost 3.25 to 8.76 points a year on the first against 4.18 to 14.23 on the second. The gap between the two lists is widest for the 15% trailing stop, 5.47 points, and narrowest for the 30% fixed stop, 0.93 points.
Members since removed made up 44.2% of the point-in-time holdings and returned 5.73% a year held to the end. For them a 30% trailing stop beat holding 32.32% of the time, against 13.77% for members still in the index, and after it sold one, holding on ended lower in 40.98% of cases. Lehman Brothers, bought at the end of 2003, was worth $0.004 per dollar when it stopped trading in September 2008; the 30% trailing stop had sold it at $1.48.
Removed members explain only part of the gap. In five-year return given up per position, the 30% trailing stop cost 41.7 points on the dated rosters and 76.9 on today’s; the removed members account for 14.2 of that 35.2-point difference, or 40%. The other 21.0 points come from companies that joined the index after the start date. Adding recorded delisting returns moves no cost figure by more than 0.01 points.
Testing a stop rule on the roster that actually existed
A stop tested on today’s S&P 500 is tested on the companies least likely to need it. On the dated rosters every stop still lost money on average, but the measured cost shrinks by 22% to 38%, and the share of sales that beat holding on rises from 14%–17% to 26%–28%.
Before setting a stop from a backtest, run it on the S&P 500 members on each past date, keep delisted companies to their last trade, and report how often the sale beat holding on alongside the average cost. The stop wins most often on companies that later leave the index, the group the study of removed S&P 500 stocks and their replacements follows after exit.
Built with xfinlink — free financial data API for Python.