
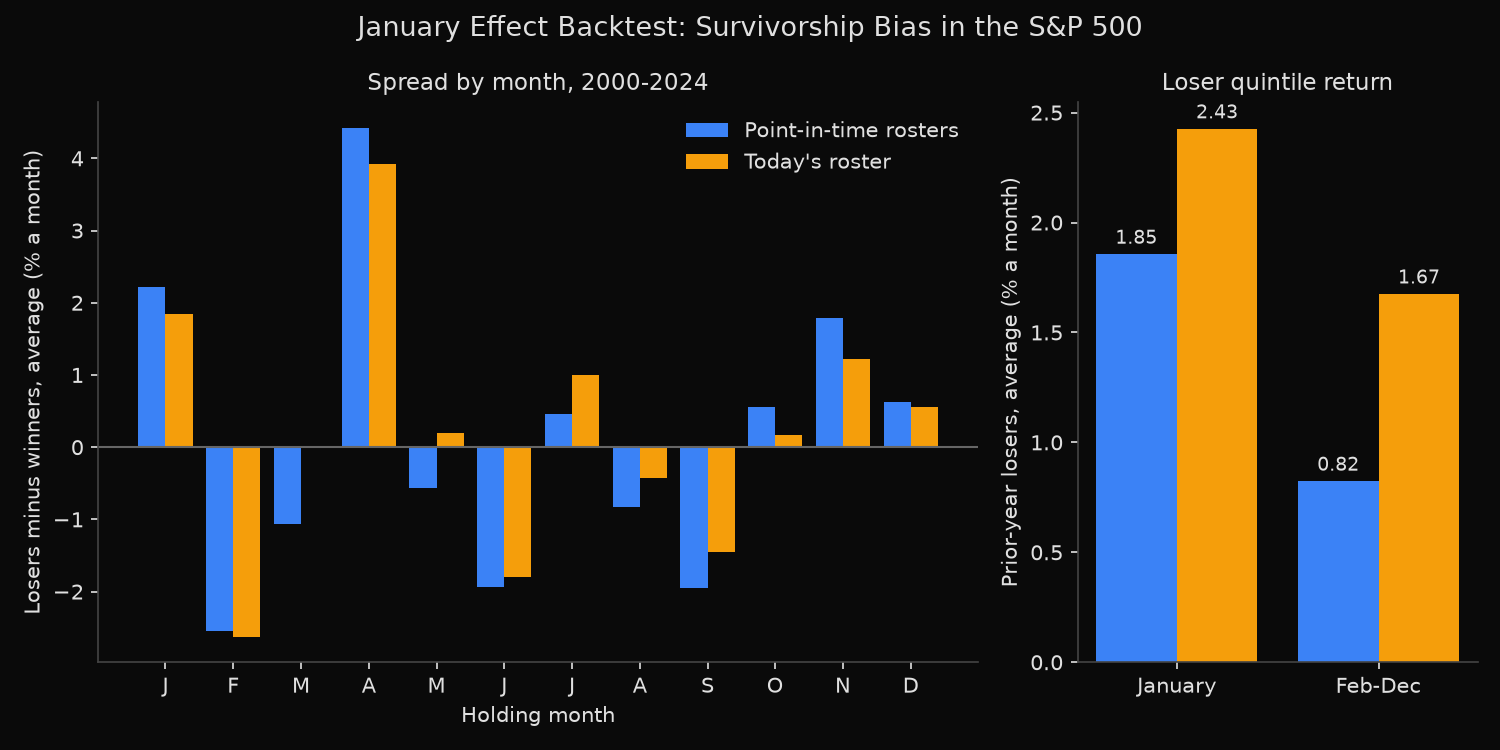
On point-in-time S&P 500 rosters, the fifth of members with the worst calendar-year return beat the best fifth by 2.22 percentage points in the average January of 2000-2024, against -0.09 points in the other months. The January figure has a t-statistic of 1.46, and 2001 supplies most of it. On today’s roster, prior-year losers earn more in eleven of twelve calendar months: 1.67% a month outside January, against 0.82%.
Do last year’s S&P 500 losers rebound in January?
The January effect is the tendency of stock returns to run higher in January than in other months. Michael Rozeff and William Kinney documented it in 1976 in the Journal of Financial Economics. The usual explanation is tax-loss selling: investors sell losing shares before 31 December to realise a capital loss, and prices recover in January. Richard Thaler’s 1987 survey in the Journal of Economic Perspectives described January gains as concentrated in small firms and in firms whose share price had declined substantially over the past few years.
For S&P 500 stocks the claim is that last year’s worst performers beat its best in January only. Testing it on today’s members drops every December loser that later left the index or stopped trading, often after falling further: exactly the outcomes a loser basket is exposed to.
Sorting each month’s roster on its trailing twelve months
- On the last trading day of each month from December 1999 to November 2024, draw the roster in force with
xfl.index("sp500", as_of=...), the historical S&P 500 constituents for that date: 300 rosters, 1,098 securities. A member removed that day is not held. - Rank members on their compounded total return over the trailing 12 months (all 12 present) and split them into equal-weight quintiles. December’s ranking is the calendar year, so its holding month is the January in question.
- Hold each quintile for the next month, 2000 to 2024. Of 461 recorded exits, 430 enter with their delisting return in the exit month; a member with no return that month leaves the average (9 cases).
- Compare 25 Januaries with 275 other months; Newey-West t-statistics allow for correlation between neighbouring observations.
- Repeat on today’s roster, entering each member once it has a full trailing year (419 names a month, against 498).
The roster calls follow the index membership reference.
Code
import numpy as np
import pandas as pd
import statsmodels.api as sm
import xfinlink as xfl

xfl.set_api_key("YOUR_API_KEY")  # free at https://xfinlink.com/signup

spy = xfl.prices("SPY", start="1999-01-01", end="2024-12-31", fields=["return_daily"])
spy["month"] = spy["date"].dt.to_period("M")
spy_m = spy.groupby("month")["return_daily"].apply(lambda r: (1 + r.fillna(0)).prod() - 1)
formation = spy.groupby("month")["date"].max().loc["1999-12":"2024-11"]

# Roster in force at each month end; a member leaving that day is not held
pit = {}
for m, d in formation.items():
    r = xfl.index("sp500", as_of=d.strftime("%Y-%m-%d")).dropna(subset=["entity_id"])
    pit[m] = set(r.loc[pd.to_datetime(r["removed_date"]) != d, "entity_id"].astype(int))
today = set(xfl.index("sp500")["entity_id"].dropna().astype(int))

# Monthly total returns; one page per batch keeps every batch's recorded exits
ids = sorted(set().union(*pit.values()) | today)
parts, exits = [], {}
for i in range(0, len(ids), 16):
    p = xfl.prices(entity_id=ids[i:i + 16], start="1999-01-01", end="2024-12-31",
                   interval="1mo", fields=["return_daily"], max_rows=100_000)
    parts.append(p)
    exits.update(p.attrs["meta"].get("delisting") or {})
px = pd.concat(parts)
px["month"] = px["date"].dt.to_period("M")
ret = (px.groupby(["month", "entity_id"])["return_daily"]
       .apply(lambda r: np.nan if r.isna().all() else (1 + r.fillna(0)).prod() - 1)
       .unstack().reindex(pd.period_range("1999-01", "2024-12", freq="M")))
for eid, ev in exits.items():  # delisting return in the exit month
    eid, dl, m = int(eid), ev.get("delisting_return"), pd.Period(ev["event_date"], "M")
    if dl is None or eid not in ret.columns or m not in ret.index:
        continue
    last = ret[eid].last_valid_index()
    if last == m:
        ret.at[m, eid] = (1 + ret.at[m, eid]) * (1 + dl) - 1
    elif last == m - 1:
        ret.at[m, eid] = dl

# Trailing 12-month return at each month end; December's is the calendar year
signal = np.expm1(np.log1p(ret).rolling(12, min_periods=12).sum())

def backtest(universe):
    rows = []
    for m in pit:
        s = signal.loc[m, [e for e in universe(m) if e in signal.columns]].dropna()
        q = np.ceil(s.rank(pct=True) * 5)       # 1 = biggest losers, 5 = biggest winners
        h = ret.loc[m + 1, s.index]             # next month; no return -> left out
        rows.append({"month": m + 1, "losers": h[q == 1].mean(), "winners": h[q == 5].mean()})
    b = pd.DataFrame(rows).set_index("month")
    b["spread"] = b["losers"] - b["winners"]
    return b

def nw(x, lags):
    fit = sm.OLS(x.values, np.ones(len(x))).fit(cov_type="HAC", cov_kwds={"maxlags": lags})
    return fit.params[0] * 100, fit.tvalues[0]

for name, universe in [("Point-in-time", lambda m: pit[m]), ("Today's roster", lambda m: today)]:
    b = backtest(universe)
    jan = b.index.month == 1
    for label, part, lags in [("January", b[jan], 1), ("Feb-Dec", b[~jan], 6)]:
        mu, t = nw(part["spread"], lags)
        print(f"{name} {label}: losers {part['losers'].mean():+.2%}, winners "
              f"{part['winners'].mean():+.2%}, spread {mu:+.2f}% (t {t:.2f}), "
              f"SPY {spy_m.reindex(part.index).mean():+.2%}")
Full script with formatting and visualisation: january-effect-survivorship-bias-python.py
Output
300 month-end rosters, 1098 securities, 461 recorded exits, 430 delisting returns applied in the exit month

Point-in-time rosters: 498 members sorted a month; member-months with no holding-month return: 9
  January (25): losers +1.85%, winners -0.37%, all members +0.27%, SPY -0.02%; losers minus winners +2.22% a month (Newey-West t 1.46)
  Feb-Dec (275): losers +0.82%, winners +0.92%, all members +0.97%, SPY +0.78%; losers minus winners -0.09% a month (Newey-West t -0.23)
  Quintile means, January: +1.85% +0.35% +0.05% -0.55% -0.37%
  Quintile means, Feb-Dec: +0.82% +1.04% +1.05% +1.03% +0.92%
  January minus other months, spread: +2.31 points (Newey-West t 1.29)
  Losers vs SPY in January: +1.88% on average, ahead in 15 of 25 Januaries; spread positive in 14 of 25
  December losers: 2480 name-years, 51.2% not in today's index, 30.6% stopped trading before 2024-12

Today's roster: 419 members sorted a month; member-months with no holding-month return: 1
  January (25): losers +2.43%, winners +0.58%, all members +0.75%, SPY -0.02%; losers minus winners +1.84% a month (Newey-West t 1.32)
  Feb-Dec (275): losers +1.67%, winners +1.61%, all members +1.46%, SPY +0.78%; losers minus winners +0.07% a month (Newey-West t 0.18)
  Quintile means, January: +2.43% +0.69% +0.22% -0.14% +0.58%
  Quintile means, Feb-Dec: +1.67% +1.38% +1.32% +1.31% +1.61%
  January minus other months, spread: +1.78 points (Newey-West t 1.05)
  Losers vs SPY in January: +2.45% on average, ahead in 18 of 25 Januaries; spread positive in 10 of 25
  December losers: 2068 name-years, 0.0% not in today's index, 0.0% stopped trading before 2024-12

January by year, losers minus winners (%):
       point-in-time  today's roster  PIT losers   SPY
month
2000            0.00           -0.76       -6.18 -4.94
2001           31.90           30.09       25.59  4.45
2002           -5.18           -8.58       -3.49 -0.98
2003           -0.15            2.42       -2.00 -2.46
2004           -2.35           -2.77        1.25  1.98
2005           -5.41           -1.88       -6.80 -2.24
2006           -4.46           -4.77        4.34  2.40
2007            0.52           -2.50        3.33  1.50
2008           14.01           12.50        3.30 -6.05
2009           -2.60           -1.08       -9.62 -8.21
2010            7.22            6.36        0.62 -3.63
2011            3.44            3.07        3.74  2.33
2012           10.62           12.03       11.29  4.64
2013            0.48           -0.34        7.53  5.12
2014            0.42           -0.83       -1.90 -3.52
2015           -6.50           -4.21       -5.72 -2.96
2016           -2.27           -2.14       -6.78 -4.98
2017            0.74            1.66        2.79  1.79
2018           -4.13           -4.33        2.64  5.64
2019            8.27            5.52       15.48  8.01
2020           -4.90           -3.97       -4.87 -0.04
2021            1.91           -2.60        1.28 -1.02
2022            5.11            3.84       -0.98 -5.27
2023           13.92           15.33       15.62  6.29
2024           -5.11           -5.96       -4.10  1.59
Januaries 2000-2012: spread point-in-time +3.66%, today's roster +3.40%
Januaries 2013-2024: spread point-in-time +0.66%, today's roster +0.16%
Januaries without 2001: spread point-in-time +0.98%, today's roster +0.67%; median January spread +0.42% and -0.83%
Januaries 2000-2012 without 2001: spread point-in-time +1.31%, today's roster +1.17%

Average by holding month, 2000-2024 (% a month):
       PIT spread  survivor spread  PIT losers  survivor losers
month
1            2.22             1.84        1.85             2.43
2           -2.54            -2.63       -1.20             0.04
3           -1.07            -0.01        0.83             2.08
4            4.42             3.92        5.01             4.97
5           -0.56             0.19        0.39             1.88
6           -1.94            -1.80       -1.50            -0.65
7            0.46             0.99        1.09             2.29
8           -0.83            -0.42       -0.12             0.84
9           -1.95            -1.45       -2.92            -1.74
10           0.56             0.16        1.62             2.07
11           1.80             1.22        4.18             4.74
12           0.62             0.55        1.67             1.88
Largest April spread: 2009-04 +39.54%; April without it +2.96%

Point-in-time December losers: in today's index +2.08% in January, not in today's index +1.63% (n=1271)
Largest January gains among December losers:
 formed ticker  past_12m  january  in_index_today
2000-12   BMCS    -0.825    1.076           False
2000-12   CPWR    -0.832    0.990           False
2000-12     CA    -0.720    0.847           False
2000-12    XRX    -0.789    0.766           False
2011-12   NFLX    -0.606    0.735            True
Largest January losses among December losers:
 formed ticker  past_12m  january  in_index_today
2008-12   FITB    -0.656   -0.711            True
2008-12     RF    -0.640   -0.565            True
2002-12    AMR    -0.704   -0.561           False
2007-12    ABK    -0.706   -0.548           False
2008-12    BAC    -0.631   -0.533            True
A January spread that rests on 2001
In January the quintile averages fall almost in order, from +1.85% for the losers to -0.37% for the winners; from February to December all five sit between 0.82% and 1.05% with no clear slope. The spread is positive in 14 of 25 Januaries, and the January-minus-other-months gap of 2.31 points has a t of 1.29.
January 2001 produced a 31.90-point spread as the stocks that fell hardest in 2000 rebounded: BMC Software rose 107.6% that month and Compuware 99.0%. Without 2001 the January average drops to 0.98 points, and the median January is 0.42. The spread also faded, from 3.66 points in 2000-2012 (1.31 without 2001) to 0.66 in 2013-2024. April, not January, is this sort’s strongest month: 4.42 points, or 2.96 without April 2009.
The survivor list changes levels more than the spread. Of 2,480 point-in-time December-loser positions, 51.2% belong to companies no longer in the index and 30.6% to companies that stopped trading before December 2024; today’s roster holds none of them, and its losers earn 2.43% in January against 1.85%. Its winners also earn more, +0.58% against -0.37%. The long-short spread shrinks to 1.84 points while the long-only basket looks better: survivor-list losers beat SPY by 2.45% in the average January and in 18 of 25 years, against 1.88% and 15 of 25.
Testing a seasonal loser basket without a survivor list
A December loser screen has to draw from the roster as it stood on each 31 December, delisted members and their exits included. Skipping it here flattered the long-only basket and slightly understated the long-short spread, so the error’s direction depends on the number reported.
On S&P 500 members since 2000, the January spread is not reliably different from zero (t 1.46). Report the median and the result without the best year next to the mean, since an edge that falls from 2.22 to 0.98 points without 2001 rests mostly on 2001, and run the sort in all twelve months: a signal that pays in April and November too cannot be credited to the tax calendar alone.
The short-term reversal backtest applies the same point-in-time comparison to last month’s losers, and the momentum strategy backtest to twelve-month winners. The S&P 500 additions and deletions history lists the dated changes behind each roster.
Built with xfinlink — free financial data API for Python.