
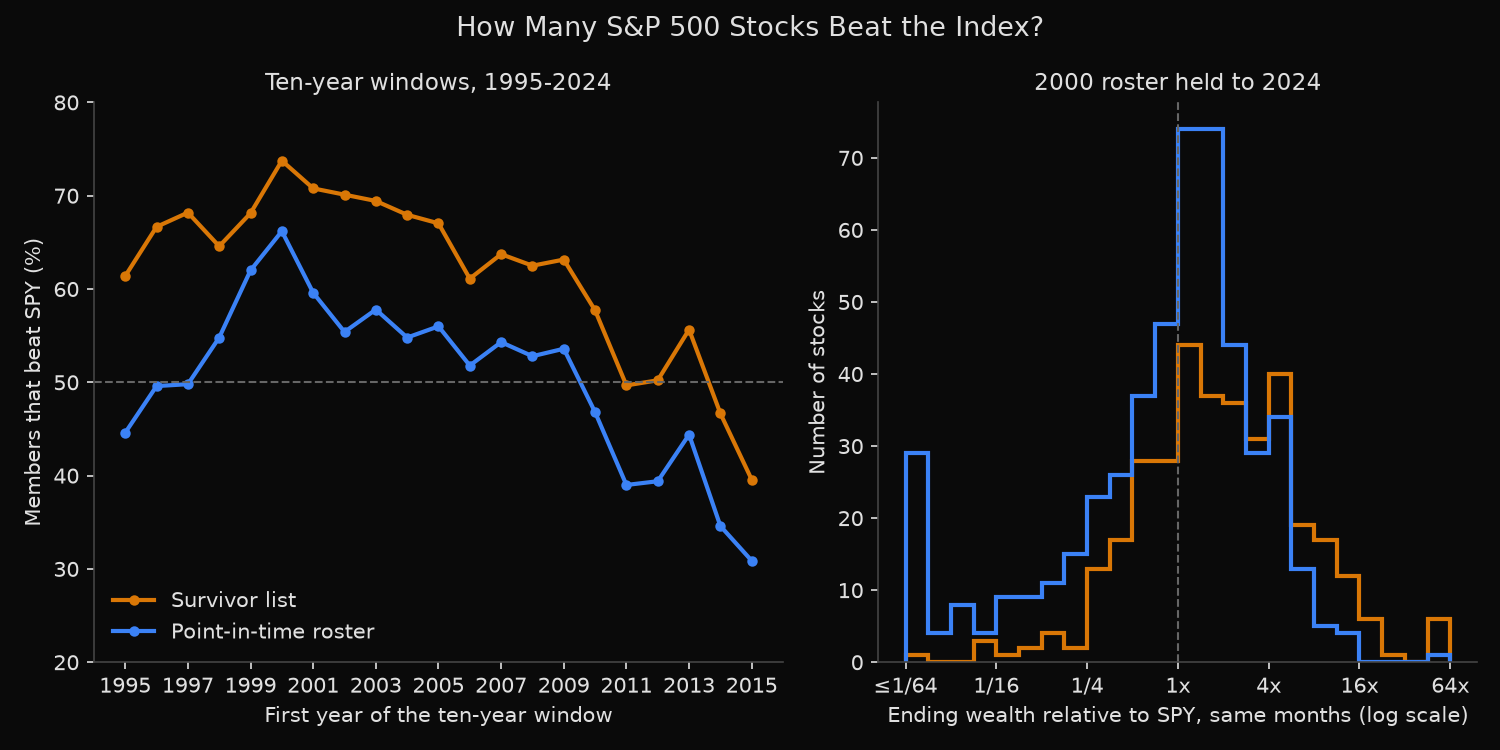
Of the 500 stocks in the S&P 500 on the first trading day of 2000, 55.6% beat SPY over the months they were held through 2024, and 24.8% lost money. A list built from today’s members that already traded in 2000 shows 71.6% beating it and 3.2% losing money; across 21 ten-year windows from 1995 to 2024, the survivor list overstated the share in every one, by 6.1 to 18.4 points.
Why the share of members beating SPY depends on which list is used
Hendrik Bessembinder’s 2018 paper in the Journal of Financial Economics, “Do stocks outperform Treasury bills?”, found that the best-performing 4% of listed US companies account for the net gain of the whole US stock market since 1926. The cause is positive skewness: a stock can lose at most 100% but can gain many times over, so a few large winners lift the average far above the typical stock. SPY, which tracks the S&P 500, earns roughly its members’ cap-weighted average, so the same arithmetic governs how often one member beats it.
That base rate needs the roster as it stood on the start date, failures and takeovers included; a list rebuilt from today’s members drops them, which is survivorship bias.
Holding every member of the January 2000 roster to its exit
- Draw the roster in force on 3 January 2000 with
xfl.index("sp500", as_of=...), the historical S&P 500 constituents for that day: 500 securities, keyed byentity_id. - Hold each one from January 2000 to December 2024 on monthly total returns. A holding ends early when the stock leaves trading, with any recorded delisting return (last close to the value recorded at the exit) in the exit month: 242 of the 251 early exits carry one, and two end at the last exchange close. Seven series pause and later resume; those holdings end at the last close before the first pause.
- A stock beats the index when its compounded return exceeds SPY’s over the same months; a company taken over in 2006 is judged against SPY for 2000-2006.
- Repeat for a survivor list: the 348 members of the 31 December 2024 roster that traded in January 2000.
- Repeat both for ten-year windows starting each January 1995-2015, with survivors from each window’s final December roster. One 2007 member with no January 2007 return is not held.
The roster calls follow the index membership reference.
Code
import numpy as np
import pandas as pd
import xfinlink as xfl

xfl.set_api_key("YOUR_API_KEY")  # free at https://xfinlink.com/signup

spy = xfl.prices("SPY", start="1993-01-01", end="2024-12-31", fields=["return_daily"])
spy["date"] = pd.to_datetime(spy["date"])
mo = spy["date"].dt.to_period("M")
spy_m = spy.groupby(mo)["return_daily"].apply(lambda r: (1 + r.fillna(0)).prod() - 1)
first_day, last_day = spy.groupby(mo)["date"].min(), spy.groupby(mo)["date"].max()

def roster(d):
    r = xfl.index("sp500", as_of=d.strftime("%Y-%m-%d")).dropna(subset=["entity_id"])
    return r.assign(entity_id=r["entity_id"].astype(int))

starts = list(range(1995, 2016))
start_ros = {y: roster(first_day[pd.Period(f"{y}-01", "M")]) for y in sorted(set(starts) | {2000})}
end_ros = {y: roster(last_day[pd.Period(f"{y}-12", "M")])
           for y in sorted({y + 9 for y in starts} | {2024})}

# Monthly total returns; one page per batch keeps every batch's exit returns
ids = sorted(set().union(*[set(r["entity_id"]) for r in [*start_ros.values(), *end_ros.values()]]))
parts, exits = [], {}
for i in range(0, len(ids), 13):
    p = xfl.prices(entity_id=ids[i:i + 13], start="1995-01-01", end="2024-12-31",
                   interval="1mo", fields=["close", "return_daily"], max_rows=100_000)
    parts.append(p)
    exits.update(p.attrs.get("meta", {}).get("delisting", {}) or {})
px = pd.concat(parts)
px["month"] = pd.to_datetime(px["date"]).dt.to_period("M")
ret = px.pivot_table(index="month", columns="entity_id", values="return_daily", aggfunc="first")
ret = ret.reindex(pd.period_range("1995-01", "2024-12", freq="M"))
for eid, ev in exits.items():      # recorded delisting return, added in the exit month
    eid, dl, m = int(eid), ev.get("delisting_return"), pd.Period(ev["event_date"], "M")
    if dl is not None and eid in ret.columns and m in ret.index:
        r0 = ret.at[m, eid]
        ret.at[m, eid] = (1 + (0 if pd.isna(r0) else r0)) * (1 + dl) - 1

def beat_share(ids, m0, m1):
    """Hold each id from m0 to m1, or to the month before its series first stops."""
    beat = []
    for e in ids:
        s = ret.loc[m0:m1, e]
        ok = s.notna().to_numpy()
        if not ok[0]:
            continue
        stop = len(s) if ok.all() else int(np.argmin(ok))
        held = s.iloc[:stop]
        beat.append((1 + held).prod() > (1 + spy_m.loc[held.index]).prod())
    return np.mean(beat) * 100, len(beat)

traded = lambda r, m: [e for e in r["entity_id"] if e in ret.columns and pd.notna(ret.at[m, e])]
for y in [2000] + starts:
    a, b = pd.Period(f"{y}-01", "M"), pd.Period(f"{2024 if y == 2000 else y + 9}-12", "M")
    pit = beat_share(sorted(start_ros[y]["entity_id"]), a, b)
    surv = beat_share(sorted(traded(end_ros[b.year], a)), a, b)
    print(f"{a}..{b}  point-in-time {pit[0]:.1f}% of {pit[1]}  survivors {surv[0]:.1f}% of {surv[1]}")
Full script with formatting and visualisation: how-many-sp500-stocks-beat-the-index-python.py
Output
Roster on 2000-01-03: 500 securities; roster on 2024-12-31: 503, of which 348 traded in 2000-01 (150 of them not members in 2000)
SPY 2000-01 to 2024-12: 526.6% total, 7.62% a year

                         point-in-time 2000 roster  today's members, traded in 2000
members                                      500.0                            348.0
held                                         500.0                            348.0
beat SPY %                                    55.6                             71.6
lost money %                                  24.8                              3.2
median total return %                        159.1                           1105.0
mean total return %                          650.1                           3406.6
top 10 share of gain %                        29.3                             47.4
names for half the gain                       31.0                             14.0

Point-in-time cohort: 251 holdings ended before 2024-12; 242 with a recorded delisting return in the exit month, 2 valued at the last exchange close, 7 stopped where the monthly series pauses and later resumes
Largest gains:
                  name    last      tr   spy  vs SPY
             APPLE INC 2024-12 322.422 5.266  50.615
          AUTOZONE INC 2024-12  98.093 5.266  14.814
UNITEDHEALTH GROUP INC 2024-12  94.778 5.266  14.285
  KANSAS CITY SOUTHERN 2021-12  71.061 3.859  13.830
   SHERWIN WILLIAMS CO 2024-12  70.243 5.266  10.370
Largest losses:
                        name    last      tr     spy  vs SPY
    NORTEL NETWORKS CORP NEW 2009-01 -0.9998 -0.3436 -0.9997
               RITE AID CORP 2023-10 -0.9990  3.3967 -0.9998
         GLOBAL CROSSING LTD 2002-01 -0.9981 -0.2112 -0.9975
LEHMAN BROTHERS HOLDINGS INC 2008-09 -0.9974 -0.0883 -0.9971
         WORLDCOM INC GA NEW 2002-07 -0.9974 -0.3606 -0.9959

Ten-year windows, share of names that beat SPY over their own months
           point-in-time n  point-in-time beat %  survivors n  survivors beat %  gap, points  SPY total %
window
1995-2004              500                  44.6          430              61.4         16.8        210.1
1996-2005              500                  49.6          438              66.7         17.1        135.5
1997-2006              500                  49.8          437              68.2         18.4        122.6
1998-2007              500                  54.8          432              64.6          9.8         75.3
1999-2008              500                  62.0          433              68.1          6.1        -13.9
2000-2009              500                  66.2          442              73.8          7.6         -9.6
2001-2010              500                  59.6          445              70.8         11.2         15.2
2002-2011              500                  55.4          445              70.1         14.7         33.0
2003-2012              500                  57.8          445              69.4         11.6         96.7
2004-2013              500                  54.8          440              68.0         13.2        103.1
2005-2014              500                  56.0          446              67.0         11.0        108.1
2006-2015              500                  51.8          450              61.1          9.3        101.0
2007-2016              499                  54.3          455              63.7          9.4         94.3
2008-2017              500                  52.8          456              62.5          9.7        125.0
2009-2018              500                  53.6          456              63.2          9.6        239.8
2010-2019              500                  46.8          454              57.7         10.9        252.8
2011-2020              500                  39.0          455              49.7         10.7        263.0
2012-2021              500                  39.4          456              50.2         10.8        358.7
2013-2022              500                  44.4          460              55.7         11.3        223.6
2014-2023              500                  34.6          465              46.7         12.1        208.6
2015-2024              502                  30.9          465              39.6          8.7        239.7
Point-in-time beat share: 30.9% to 66.2%, below 50% in 9 of 21 windows; survivor list higher in 21 of 21, by 6.1 to 18.4 points (median 10.9)
One stock in 16 carried half the gain
The 2000 cohort’s median total return is 159.1% and its mean 650.1%. Apple returned 32,242%, ending with 51.6 times SPY’s wealth over the same months; AutoZone and UnitedHealth each returned more than 9,000%; Nortel, Rite Aid, Global Crossing, Lehman Brothers and WorldCom each lost more than 99.7%. With an equal dollar in each name, the top 10 supply 29.3% of the combined gain and 31 names, about one in 16, supply half.
A median below SPY’s 526.6% fits a 55.6% beat rate because the 251 early exits are each measured against SPY over their own shorter span.
The start date moves the rate a long way. SPY lost 9.6% over 2000-2009, so a modest gain was enough, and the point-in-time share peaks there at 66.2%. From the 2010 window on it stays below 50%, reaching 30.9% for 2015-2024, when SPY gained 239.7%; nine of the 21 windows fall below one half.
The survivor list sits higher in all 21 windows, by a median 10.9 points. It removes the members that went to zero, and in the 2000 cohort the share that lost money falls from 24.8% to 3.2%. It also adds 150 companies that joined the index after 2000, chosen with knowledge of how the next 25 years went, and the list’s median return of 1,105% reflects that selection.
Using a point-in-time base rate to judge a stock picker
A stock-selection rule should be scored against the point-in-time beat rate for its start date, not against 50% or a survivor list. From 2000, a screen whose picks beat SPY 55% of the time has added nothing on the real roster, while on a survivor list even a random pick scores 71.6%. Because the rate swings from 30.9% to 66.2% with the start year, a test should report several.
With half of the roster’s gain in 31 of 500 names, a 20-stock portfolio drawn at random holds about 1.2 of them on average. That favours owning the index unless the selection method has a tested edge. The study of how many S&P 500 members remain after 20 years covers the turnover behind the survivor gap, and a comparison of new and veteran members looks at returns by time in the index.
Built with xfinlink — free financial data API for Python.