
A momentum strategy backtest run on today’s S&P 500 roster, instead of the roster each month actually had, lifts the top momentum decile from 8.11% to 21.23% a year over 2000-2024 and the loser decile even further, from 4.57% to 19.95%. On point-in-time rosters the winners trail an equal-weight portfolio of the whole index by 1.67 percentage points a year; on today’s roster they beat it by 4.69 points, which reverses the verdict on long-only momentum.
Does a survivor roster flatter momentum winners or losers?
Cross-sectional momentum ranks stocks on their own past return and buys the ones that rose most. The common signal is the 12-1 return: the gain over the past twelve months excluding the latest one, which tends to reverse in the short run. The top tenth is the winner decile and the bottom tenth the loser decile.
Survivorship bias is the error of testing on a universe chosen with knowledge of the future, here the companies still in the index today. It is usually described as a uniform lift in returns, but the two momentum legs hold different kinds of stock: a loser decile is full of companies in trouble, and trouble is how companies leave the index. Which leg the bias favours decides what the backtest appears to say.
Two universes, one 12-1 momentum rule
- Draw the S&P 500 roster on the last business day of each month from December 1999 to November 2024 with
xfl.index("sp500", as_of=...): 300 point-in-time rosters. - Draw today’s roster once (503 rows on 19 October 2026) and apply it to every month: the survivor universe.
- Pull monthly total returns from 1999 to 2024 for every security either universe holds, 1,095 of which traded in that window, keyed by entity id rather than ticker so a recycled symbol cannot swap companies mid-test.
- Each month end, score stocks with eleven months of history on 12-1 momentum, hold the top and bottom deciles in equal weight for one month, and compare them with an equal-weight portfolio of every scored stock.
- A holding that stops trading mid-month earns its return through its last trading day and sits in cash for the rest of the month.
The survivor universe holds 323 scored names in January 2000, because many of today’s members had not yet listed. The script needs a paid plan: 300 dated rosters are more than the Free plan’s daily as_of allowance, and the price history reaches back past its rolling twelve months. The index membership reference documents the as_of roster call.
Code
import xfinlink as xfl
import numpy as np
import pandas as pd

xfl.set_api_key("YOUR_API_KEY")  # free at https://xfinlink.com/signup

# Formation dates: last business day of each month, Dec 1999 to Nov 2024
dates = pd.date_range("1999-12-01", "2024-11-30", freq="BME")
pit = {d.to_period("M"): set(xfl.index("sp500", as_of=d.strftime("%Y-%m-%d"))
                             .entity_id.dropna().astype(int)) for d in dates}
today = set(xfl.index("sp500").entity_id.dropna().astype(int))

# Monthly total returns for every company either universe ever holds
ids = sorted(set().union(*pit.values()) | today)
px = pd.concat(xfl.prices(entity_id=ids[i:i + 25], start="1999-01-01", end="2024-12-31",
                          interval="1mo", fields=["return_daily"], max_rows=100_000)
               for i in range(0, len(ids), 25))
px["month"] = px["date"].dt.to_period("M")
ret = px.pivot(index="month", columns="entity_id", values="return_daily")

# 12-1 momentum: compounded return over months t-11..t-1, skipping month t
mom = np.expm1(np.log1p(ret).shift(1).rolling(11, min_periods=11).sum())
nxt = ret.shift(-1)  # return in the holding month t+1

def backtest(universe):
    rows = []
    for m in pit:
        score = mom.loc[m, [i for i in universe(m) if i in mom.columns]].dropna()
        hold = nxt.loc[m, score.index].fillna(0.0)  # no bar after an exit: cash
        top, bottom = score >= score.quantile(0.9), score <= score.quantile(0.1)
        rows.append({"month": m + 1, "names": len(score), "winners": hold[top].mean(),
                     "losers": hold[bottom].mean(), "universe": hold.mean(),
                     "winners_gone": (~score.index[top].isin(today)).mean(),
                     "losers_gone": (~score.index[bottom].isin(today)).mean()})
    return pd.DataFrame(rows).set_index("month")

cagr = lambda r: (1 + r).prod() ** (12 / len(r)) - 1
books = {"point-in-time": backtest(lambda m: pit[m]), "today's roster": backtest(lambda m: today)}
for name, b in books.items():
    print(f"{name}: {b.names.mean():.0f} names a month, " + ", ".join(
        f"{leg} {cagr(b[leg]):.2%}" for leg in ["winners", "losers", "universe"])
        + f", winners minus universe {cagr(b.winners) - cagr(b.universe):+.2%}")
    for a, z in [("2000", "2012"), ("2013", "2024")]:
        p = b.loc[a:z]
        print(f"  {a}-{z}: winners {cagr(p.winners):.2%}, losers {cagr(p.losers):.2%}, universe {cagr(p.universe):.2%}")
pt = books["point-in-time"]
print(f"point-in-time names no longer in the index today: winners {pt.winners_gone.mean():.1%}, losers {pt.losers_gone.mean():.1%}")
Full script with formatting and visualisation: momentum-strategy-backtest-survivorship-bias-python.py
Output
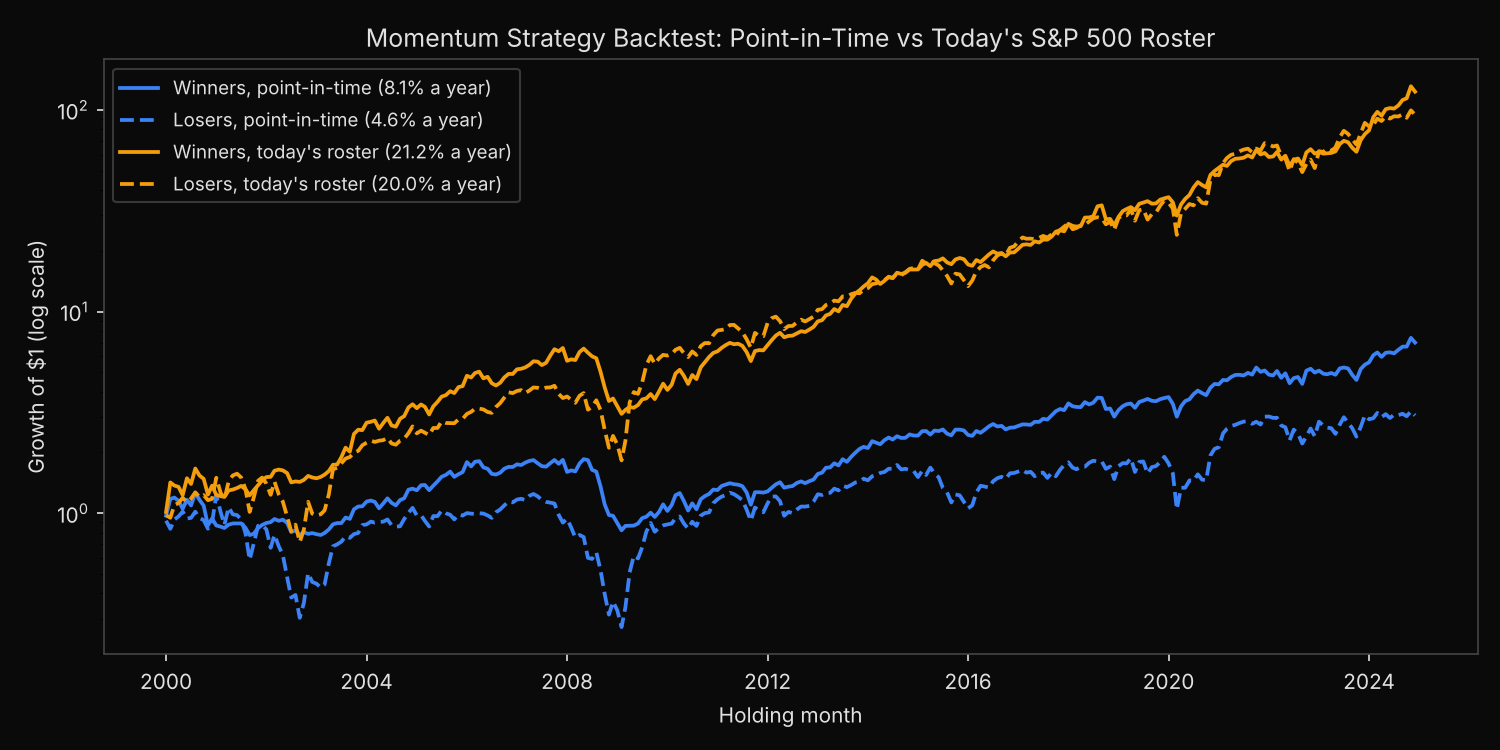
point-in-time: 499 names a month, winners 8.11%, losers 4.57%, universe 9.78%, winners minus universe -1.67%
  2000-2012: winners 3.00%, losers 1.03%, universe 7.20%
  2013-2024: winners 13.92%, losers 8.54%, universe 12.63%
today's roster: 419 names a month, winners 21.23%, losers 19.95%, universe 16.54%, winners minus universe +4.69%
  2000-2012: winners 17.78%, losers 18.85%, universe 15.19%
  2013-2024: winners 25.08%, losers 21.16%, universe 18.02%
point-in-time names no longer in the index today: winners 39.7%, losers 57.4%
Why the loser decile gains the most from survivors
Every portfolio gains from the survivor roster, but unequally: the universe gains 6.76 percentage points a year, the winners 13.12 and the losers 15.38. The last output line shows why. Of the stocks the point-in-time loser decile held, 57.4% are no longer in the index, against 39.7% for the winner decile. A stock that has fallen hard is more likely to be removed, taken over or delisted, and the survivor roster keeps only the fallen stocks that went on to be members today, so its loser decile leans toward rebounds.
The asymmetry changes the shape of the result. On point-in-time rosters the winners beat the losers in both halves, 3.00% against 1.03% a year in 2000-2012 and 13.92% against 8.54% in 2013-2024. On today’s roster the losers win from 2000 to 2012, 18.85% against 17.78%, as if momentum had run backwards for thirteen years. No single company drives this: dropping the five largest contributors to the survivor winner decile leaves it above 19.5% a year, and capping every monthly return at +100% moves no full-period figure by 0.8 points or more and leaves the order of winners and losers unchanged in every half.
Building a momentum backtest on point-in-time rosters
Form the universe from the roster in force on each rebalance date, and keep each holding through its holding month even when it leaves the index. The historical S&P 500 constituents lookup shows the roster on any single date, a quick check on a backtest universe.
Judge the legs separately. A survivor universe distorts the loser leg most, and that is the leg a short book or an avoid-list relies on. The explainer on survivorship bias in backtesting covers why the error arises, and the point-in-time S&P 500 equal-weight comparison applies a roster test to a portfolio with no signal. What happens to stocks after removal is the subject of a replacement-pair study of S&P 500 deletions.
Built with xfinlink — free financial data API for Python.