
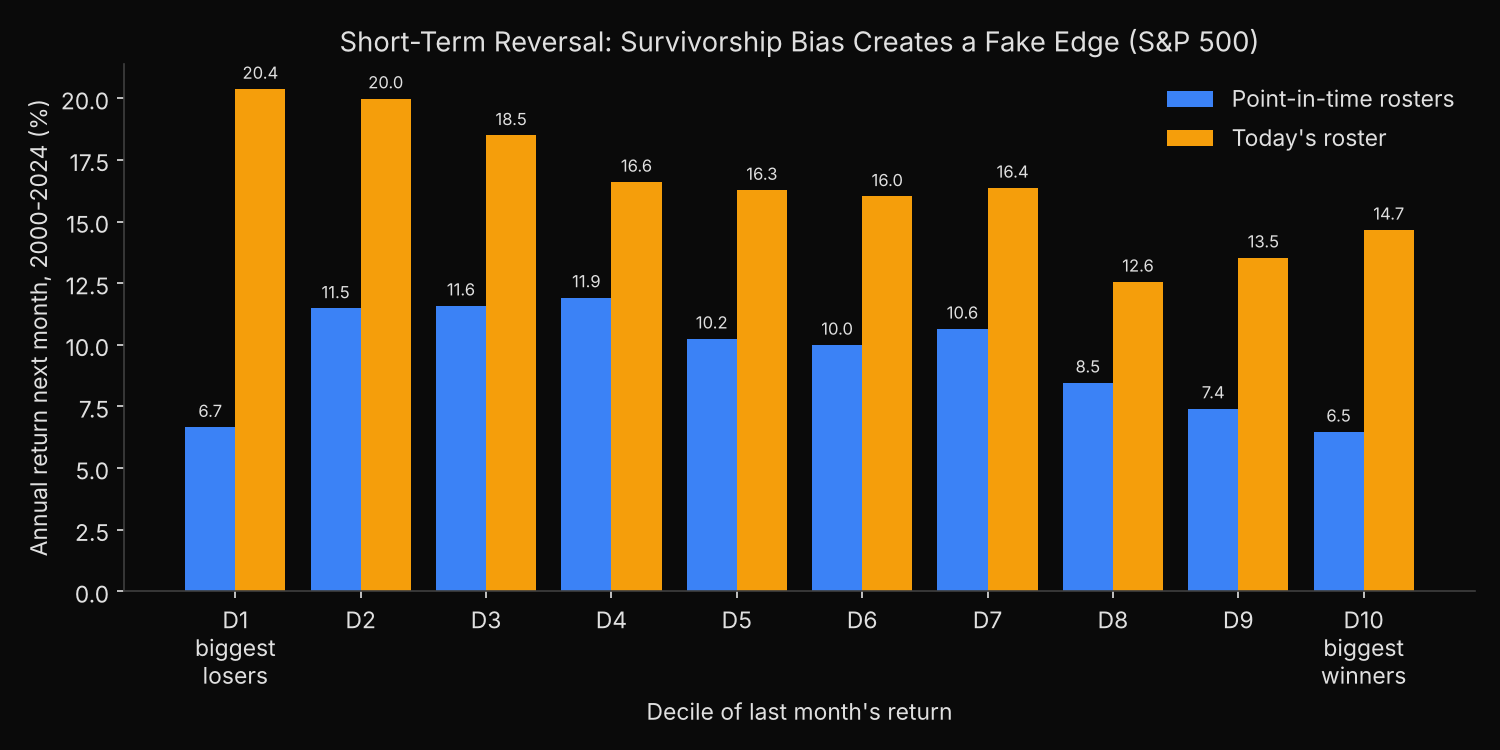
On the S&P 500 roster each month actually had, the tenth of members that fell most in the previous month earned 6.66% a year in the month that followed, 2000 to 2024, and the tenth that rose most earned 6.47%: a gap of 0.19 points, with a t-statistic of 0.58. Run the same sort on today’s roster and last month’s losers lead by 5.71 points, 20.37% a year against 14.66%. The short-term reversal edge in that backtest belongs to the survivor list, not to the stocks.
Why would a survivor list favour last month’s losers?
Short-term reversal is the tendency of a stock that fell hard in one month to recover some of the loss in the next, and of a sharp riser to give some back.
A stock that dropped 13% in a month can go two ways from there: it recovers, or it keeps falling until it is removed from the index, taken over or delisted. Today’s S&P 500 list contains only the first kind, plus companies that rose enough to join later. The guide to survivorship bias in backtesting describes the general mechanism; a reversal rule is exposed to it because it buys stocks in distress. The 12-month momentum test on point-in-time and survivor rosters runs the same comparison on the opposite signal.
Sorting each month’s members by their last monthly return
- Draw the S&P 500 roster on the last business day of each month from December 1999 to November 2024 with
xfl.index("sp500", as_of=...); each roster sets the next month’s universe. The index membership reference documentsas_of. - Pull monthly total returns from December 1999 for the 1,100 securities involved, keyed by entity id so a recycled ticker cannot swap companies.
- Rank each month’s universe by its return in the month before, split it into ten deciles and hold each decile equally weighted for one month. A holding that stops trading earns its return through its last trading day.
- Repeat with today’s roster as every month’s universe.
Code
import numpy as np
import pandas as pd
import xfinlink as xfl

xfl.set_api_key("YOUR_API_KEY")  # free at https://xfinlink.com/signup

# The S&P 500 roster on the last business day of each month, Dec 1999 to Nov 2024,
# sets the universe for the following month
dates = pd.date_range("1999-12-01", "2024-11-30", freq="BME")
pit = {d.to_period("M") + 1: set(xfl.index("sp500", as_of=d.strftime("%Y-%m-%d"))
                                 .entity_id.dropna().astype(int)) for d in dates}
today = set(xfl.index("sp500").entity_id.dropna().astype(int))

# Monthly total returns, keyed by entity id so a recycled ticker cannot swap companies
ids = sorted(set().union(*pit.values()) | today)
px = pd.concat(xfl.prices(entity_id=ids[i:i + 25], start="1999-12-01", end="2024-12-31",
                          interval="1mo", fields=["return_daily"], max_rows=100_000)
               for i in range(0, len(ids), 25))
px["month"] = px["date"].dt.to_period("M")
ret = px.pivot(index="month", columns="entity_id", values="return_daily")
signal = ret.shift(1)  # last month's return, known at the month end
ret, signal = ret.loc["2000-01":], signal.loc["2000-01":]
print(f"{len(pit)} monthly rosters, {len(ids)} securities, {len(ret)} holding months")

def membership(members):
    return pd.DataFrame([ret.columns.isin(list(members(m))) for m in ret.index],
                        index=ret.index, columns=ret.columns)

pit_mask, today_mask = membership(lambda m: pit[m]), membership(lambda m: today)
annual = lambda r: (1 + r).prod() ** (12 / len(r)) - 1
results = {}
for name, mask in {"Point-in-time rosters": pit_mask, "Today's roster": today_mask}.items():
    s = signal.where(mask)
    decile = np.ceil(s.rank(axis=1, pct=True) * 10)  # 1 = last month's biggest losers
    d = {k: ret.where(decile == k).mean(axis=1) for k in range(1, 11)}
    print(f"{name}: {s.notna().sum(axis=1).mean():.0f} stocks sorted a month on average, "
          f"universe {annual(ret.where(s.notna()).mean(axis=1)):.2%} a year")
    print("  Deciles 1-10: " + " ".join(f"{annual(d[k]):.1%}" for k in range(1, 11)))
    for k, label in [(1, "Losers"), (10, "Winners")]:
        held = decile == k
        gone = (held & ~today_mask).sum(axis=1).div(held.sum(axis=1)).mean()
        print(f"  {label} (D{k}): last month {s.where(held).stack().mean():+.1%}, "
              f"next month {annual(d[k]):.2%} a year, not in today's index {gone:.1%}")
    spread = d[1] - d[10]
    years = ((1 + d[1]).groupby(d[1].index.year).prod()
             > (1 + d[10]).groupby(d[10].index.year).prod())
    print(f"  Losers minus winners: {annual(d[1]) - annual(d[10]):+.2%} a year "
          f"(2000-2012 {annual(d[1][:'2012']) - annual(d[10][:'2012']):+.2%}, "
          f"2013-2024 {annual(d[1]['2013':]) - annual(d[10]['2013':]):+.2%}); "
          f"t-stat {spread.mean() / spread.std() * len(spread) ** 0.5:.2f}; "
          f"losers ahead in {years.sum()} of {len(years)} years")
    results[name] = d

held = np.ceil(signal.where(pit_mask).rank(axis=1, pct=True) * 10) == 1
print(f"Point-in-time losers still in the index today: {annual(ret.where(held & today_mask).mean(axis=1)):.2%} a year; "
      f"since removed: {annual(ret.where(held & ~today_mask).mean(axis=1)):.2%} a year")
Full script with formatting and visualisation: short-term-reversal-survivorship-bias-python.py
Output
300 monthly rosters, 1100 securities, 300 holding months
Point-in-time rosters: 502 stocks sorted a month on average, universe 9.79% a year
  Deciles 1-10: 6.7% 11.5% 11.6% 11.9% 10.2% 10.0% 10.6% 8.5% 7.4% 6.5%
  Losers (D1): last month -13.0%, next month 6.66% a year, not in today's index 49.3%
  Winners (D10): last month +15.6%, next month 6.47% a year, not in today's index 43.5%
  Losers minus winners: +0.19% a year (2000-2012 +0.40%, 2013-2024 -0.05%); t-stat 0.58; losers ahead in 12 of 25 years
Today's roster: 425 stocks sorted a month on average, universe 16.80% a year
  Deciles 1-10: 20.4% 20.0% 18.5% 16.6% 16.3% 16.0% 16.4% 12.6% 13.5% 14.7%
  Losers (D1): last month -12.1%, next month 20.37% a year, not in today's index 0.0%
  Winners (D10): last month +16.5%, next month 14.66% a year, not in today's index 0.0%
  Losers minus winners: +5.71% a year (2000-2012 +10.43%, 2013-2024 +0.51%); t-stat 1.60; losers ahead in 16 of 25 years
Point-in-time losers still in the index today: 12.15% a year; since removed: 0.69% a year
Where the survivor list finds its rebound
On point-in-time rosters there is no reversal to speak of. Both extreme deciles trail the rest of the index: the biggest losers return 6.66% a year and the biggest winners 6.47%, while deciles 2 to 4 earn between 11.5% and 11.9% and the whole universe 9.79%. Losers finished ahead of winners in 12 of the 25 calendar years, and since 2013 the gap is slightly negative, at −0.05 points.
The membership figures show what the survivor list removes. In an average month, 49.3% of the point-in-time loser decile is made up of companies that are not in today’s index, against 43.5% of the winner decile. Split along that line, the losers form two very different groups: the ones still in the index today earned 12.15% a year in the month after their fall, and the ones since removed earned 0.69%. A backtest on today’s roster drops the second group entirely, and adds companies that joined the index later.
Dropping the removed companies, and adding the ones that joined later, produces the 5.71-point edge. On today’s roster the loser decile earns 20.37% a year, 13.71 points more than the point-in-time losers, while the winner decile gains a smaller 8.19 points. The lift is concentrated in 2000–2012, when the survivor spread reaches 10.43 points a year; from 2013 it falls to 0.51. Even on today’s roster the spread is statistically weak (t-statistic 1.60, losers ahead in 16 of 25 years), though the annualised figures still show a 5.71-point edge. Extreme months do not drive either result: capping each holding-month return at +100% leaves the spreads at −0.18 points on point-in-time rosters and 5.28 on today’s.
Testing a buy-the-dip rule without the survivor lift
Any rule that buys recent losers, whether a one-month reversal or a buy-the-dip screen, selects stocks at the moment their fate is least settled. A universe drawn from today’s constituents settles it in advance, so such a rule should be tested on the roster in force on each rebalance date, each member staying in the universe until the date it left. The historical S&P 500 constituents lookup shows the membership on any past date, and the same rosters come through as_of in code.
Treat a reversal edge that appears only on a current constituent list as a property of the list. On the rosters investors could actually have traded, the gap between large-cap losers and winners was 0.19 points a year from 2000 to 2024; the survivor result rests on a list chosen knowing which companies would recover or grow. What happens to companies after they leave the index is the subject of the study of S&P 500 deletions and their replacements.
Built with xfinlink — free financial data API for Python.