
A price-to-book value backtest run on today’s S&P 500 list adds 5.1 to 7.5 points a year to every quintile’s return from 2000 to 2024, yet moves the cheap-minus-expensive spread by only 1.0 point: 2.68 points a year against 1.72 on the rosters the index actually had. Neither spread is reliable (t-statistics 0.66 and 0.47). The survivor list mostly inflates what a value portfolio appears to earn, not how far value appears to beat growth.
Does a survivor list flatter cheap stocks?
A value strategy buys companies whose market value is low relative to book equity, assets minus liabilities; the guide to book value and P/B defines both measures. Some cheap stocks keep falling until they are acquired, demoted or delisted, and a test drawn from today’s index list never meets them, the survivorship bias set out in the guide to survivorship bias in backtesting. Kothari, Shanken and Sloan argued in the Journal of Finance in 1995 that earlier book-to-market results were affected by selection bias in the accounting data behind them. The hypothesis: today’s list drops the cheap members that later failed, so value looks better than it was.
Sorting S&P 500 members by book-to-market each December
- Take the roster on the last business day of each December, 1999 to 2023, with
xfl.index("sp500", as_of=...). Today’s roster, the same call without a date, had 502 members with a ticker on 16 November 2026. - Read market value at that close and P/B from the latest balance sheet reported by that date (
xfl.metricswithas_of); where P/B is blank, take book equity from the latest statement filed by the date (xfl.fundamentalswithas_of). The point-in-time reference describes the rule. Companies without a usable book value on the sort date drop from that year’s sort. - Sort positive-book companies into book-to-market quintiles, Q5 the cheapest. Negative book equity, about 13 companies a year, is its own group.
- Hold for the next calendar year, equal-weighted and rebalanced monthly, with monthly total returns. A stock that stops trading takes its recorded delisting return; an exit with no recorded value keeps its last price.
- Run three universes: point-in-time rosters; those members still in the index today; and today’s roster, every company on it that traded on the sort date, including before it joined.
Code
import numpy as np
import pandas as pd
import xfinlink as xfl

xfl.set_api_key("YOUR_API_KEY")  # free at https://xfinlink.com/signup

RUN_DATE = pd.Timestamp("2026-11-16")  # the day today's roster was read
FIELDS = ["market_cap", "pb_ratio"]
forms = pd.date_range("1999-12-01", "2023-12-31", freq="BYE")  # last business day of December
ymd = lambda d: d.strftime("%Y-%m-%d")

def snapshot(d, tickers=None, issuers=None):
    """Market value (all share classes) on the close of d and P/B from statements filed by d."""
    kw = dict(period_type="ttm", fields=FIELDS, as_of=ymd(d))
    if tickers is not None:  # start/end only date the tickers' resolution; as_of fixes the snapshot
        m = xfl.metrics(tickers, start=ymd(d - pd.Timedelta(days=300)), end=ymd(d), **kw)
    else:
        m = pd.concat([xfl.metrics(entity_id=issuers[i:i + 500], **kw) for i in range(0, len(issuers), 500)])
    return m[["entity_id", "ticker", "entity_name", "priced_on", "period_end"] + FIELDS]

# Today's roster: security ids for prices, issuer ids for statements
today = xfl.index("sp500").dropna(subset=["entity_id", "ticker"])
today_iss = snapshot(RUN_DATE, tickers=today["ticker"].tolist())
sec_of = dict(zip(today_iss["entity_id"], today_iss["ticker"].map(dict(zip(today["ticker"], today["entity_id"])))))

snaps = []
for d in forms:
    roster = xfl.index("sp500", as_of=ymd(d)).dropna(subset=["entity_id", "ticker"])
    a = snapshot(d, tickers=roster["ticker"].tolist()).assign(pit=True)
    a["sec"] = a["ticker"].map(dict(zip(roster["ticker"], roster["entity_id"])))
    extra = sorted(set(sec_of) - set(a["entity_id"]))  # today's companies outside that roster
    b = snapshot(d, issuers=extra).assign(pit=False)
    b["sec"] = b["entity_id"].map(sec_of)
    snaps.append(pd.concat([a, b]).assign(form=d, roster_size=len(roster)))
S = pd.concat(snaps, ignore_index=True).dropna(subset=["sec", "market_cap"])
S["sec"] = S["sec"].astype(int)
S["today"] = S["entity_id"].isin(set(sec_of))

# Book equity: P/B where the snapshot has it, else the latest equity filed by the date
eq = []
for d, g in S.groupby("form"):
    f = xfl.fundamentals(entity_id=sorted(g["entity_id"].unique()), as_of=ymd(d),
                         start=ymd(d - pd.DateOffset(years=2)), fields=["total_equity"], max_rows=50_000)
    f = f.dropna(subset=["total_equity"]).sort_values("period_end").drop_duplicates("entity_id", keep="last")
    eq.append(f[["entity_id", "total_equity"]].assign(form=d))
S = S.merge(pd.concat(eq), on=["form", "entity_id"], how="left")
S["book"] = (S["market_cap"] / S["pb_ratio"]).fillna(S["total_equity"])
S = S.dropna(subset=["book"])
S["bm"] = S["book"] / S["market_cap"]
S["year"] = S["form"].dt.year + 1

# Monthly total returns 2000-2024 by security
ids = sorted(S["sec"].unique())
px = pd.concat(xfl.prices(entity_id=ids[i:i + 200], start="2000-01-01", end="2024-12-31", interval="1mo",
                          fields=["return_daily"], max_rows=250_000) for i in range(0, len(ids), 200))
px["m"] = px["date"].dt.to_period("M")
R = px.drop_duplicates(["entity_id", "m"]).pivot(index="m", columns="entity_id", values="return_daily")
R = R.reindex(index=pd.period_range("2000-01", "2024-12", freq="M"), columns=ids)

# Exits: recorded delisting return in the exit month (single-page calls, one exit year each)
last = R.apply(pd.Series.last_valid_index).dropna()
ended = last[last < pd.Period("2024-12", "M")]
delist = {}
for y, g in ended.groupby(ended.map(lambda p: p.year)):
    g = g.index.tolist()
    for i in range(0, len(g), 300):
        d = xfl.prices(entity_id=g[i:i + 300], start=f"{y}-01-01", end="2024-12-31", interval="1mo",
                       fields=["return_daily"])
        delist.update({int(k): v for k, v in (d.attrs["meta"].get("delisting") or {}).items()})
for e, v in delist.items():
    dr = v.get("delisting_return")
    if e in last.index and dr is not None and not np.isnan(dr):
        m = last[e] if pd.Period(v["event_date"], "M") <= last[e] else last[e] + 1
        if m <= R.index[-1]:
            R.loc[m, e] = (1 + np.nan_to_num(R.loc[m, e])) * (1 + dr) - 1

def universe(mask):
    u = S[mask].drop_duplicates(["form", "entity_id"]).copy()
    pos = u["book"] > 0
    u["q"] = 0  # 0 = negative book equity, its own group
    u.loc[pos, "q"] = u[pos].groupby("form")["bm"].transform(
        lambda s: np.ceil(s.rank(pct=True) * 5)).astype(int)  # 1 = most expensive, 5 = cheapest
    return u

def year_return(g, y, weights=None):  # equal weight (or formation market value), rebalanced monthly
    r = R.loc[f"{y}-01":f"{y}-12", g["sec"].tolist()]
    w = pd.Series(1.0 if weights is None else g[weights].values, index=r.columns)
    return (1 + ((r * w).sum(axis=1) / r.notna().mul(w).sum(axis=1)).fillna(0)).prod() - 1

U = {"Point-in-time rosters": universe(S["pit"]),
     "Point-in-time, still members today": universe(S["pit"] & S["today"]),
     "Today's roster": universe(S["today"])}
res = {k: pd.DataFrame([{"year": y, "q": q, "n": len(g), "ew": year_return(g, y),
                         "vw": year_return(g, y, "market_cap")}
                        for (y, q), g in u.groupby(["year", "q"])]).pivot(index="year", columns="q")
       for k, u in U.items()}
tstat = lambda s: s.mean() / s.std() * len(s) ** 0.5
spread = {k: t["ew"][5] - t["ew"][1] for k, t in res.items()}
for k, s in spread.items():
    print(k, f"Q5-Q1 {s.mean():+.4f} a year, t {tstat(s):.2f}")
Full script with formatting and visualisation: value-investing-backtest-survivorship-bias-python.py
Output
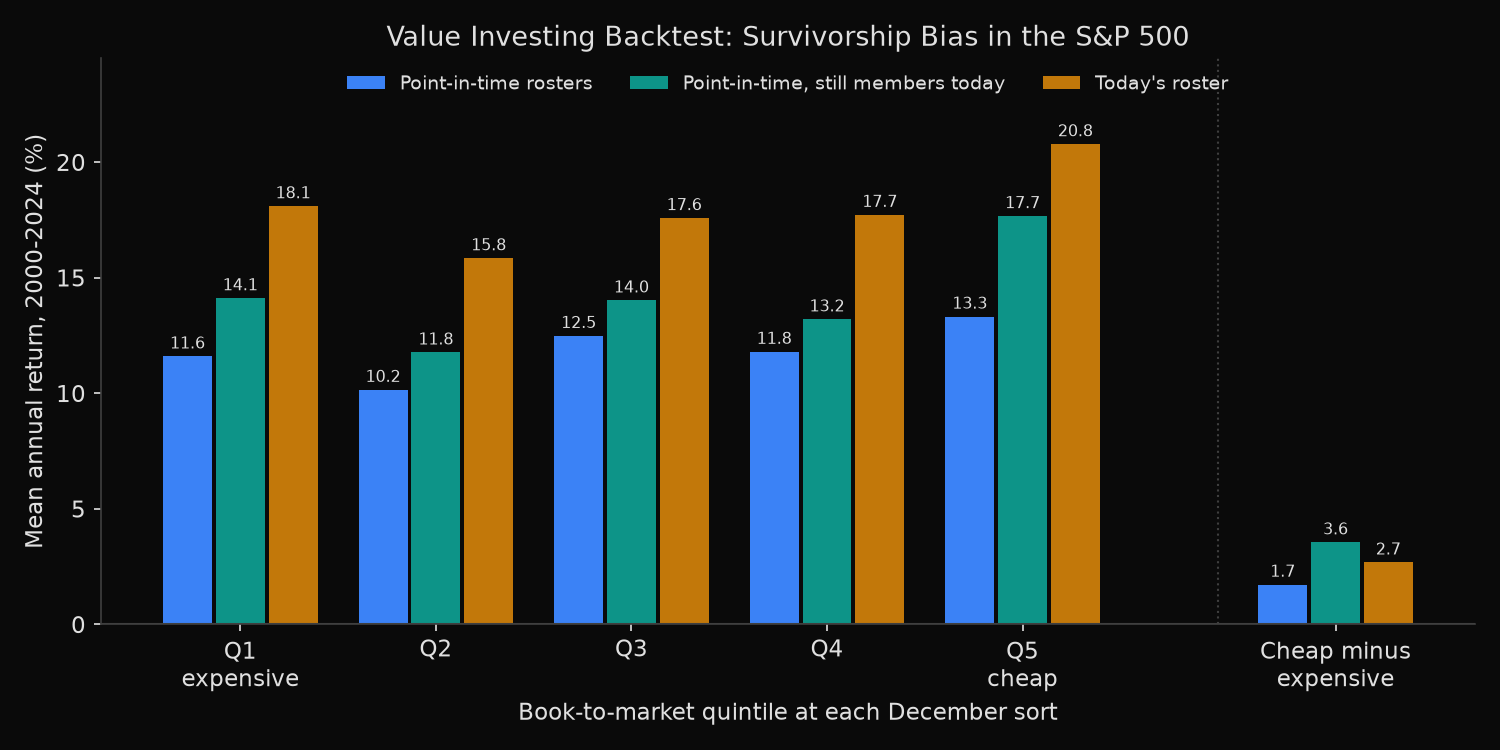
25 December sorts, 1999-12-31 to 2023-12-29; holding years 2000-2024; today's roster: 502 members on 2026-11-16; 1006 securities, 356 exit records

Mean annual return by book-to-market quintile, equal weight, 2000-2024
universe                             names neg BE  Q1 exp     Q2     Q3     Q4 Q5 cheap  Q5-Q1     t  Q5>Q1
Point-in-time rosters                  462  15.9%   11.6%  10.2%  12.5%  11.8%    13.3%  +1.72  0.47  14/25
Point-in-time, still members today     294  17.3%   14.1%  11.8%  14.0%  13.2%    17.7%  +3.55  1.01  13/25
Today's roster                         414  32.7%   18.1%  15.8%  17.6%  17.7%    20.8%  +2.68  0.66  13/25

Today's roster minus point-in-time, value spread: +0.96 points a year, paired t 0.50; larger in 10 of 25 years
Today's roster minus point-in-time, average of the five quintiles: +6.14 points a year
Point-in-time rosters: Q5-Q1 2000-2012 +7.47, 2013-2024 -4.50; weighted by market value -0.83 (t -0.19)
Today's roster: Q5-Q1 2000-2012 +9.45, 2013-2024 -4.64; weighted by market value +0.76 (t 0.16)

Point-in-time quintiles: who left, and what they earned (mean annual return)
  Q1 expensive  median P/B  9.17  not in today's index 32.3%  stopped trading within the year 1.8% (dropped 0.0%)  still members  14.1%  since removed   3.2%
  Q5 cheap      median P/B  1.19  not in today's index 43.1%  stopped trading within the year 2.7% (dropped 0.4%)  still members  18.9%  since removed   5.1%
  negative BE   median P/B -17.17  not in today's index 27.2%  stopped trading within the year 2.8% (dropped 0.6%)  still members  17.3%  since removed   9.0%

Known collapses in the point-in-time sort (P/B at the December before, quintile, return that year)
  ENE  2001  P/B  6.05  Q2  -99.3%
  BSC  2008  P/B  0.81  Q5  -89.6%
  LEH  2008  P/B  1.69  Q4  -99.9%
  WM   2008  P/B  0.50  Q5  -98.8%
  SIVB 2023  P/B  0.88  Q5  -82.9%
  FRC  2023  P/B  1.60  Q5  -99.7%

Today's roster: share of each quintile not yet an index member at the sort, Q0 35.2%, Q1 32.2%, Q2 30.4%, Q3 28.2%, Q4 26.9%, Q5 25.6%
Names a year by group: Point-in-time rosters: neg BE 13; Point-in-time, still members today: neg BE 9; Today's roster: neg BE 14
Where the six extra points come from
Today’s roster earns 15.8% to 20.8% a year across the quintiles, against 10.2% to 13.3% point-in-time, an average lift of 6.14 points. The list holds only companies that grew enough to join or stay, so its absolute returns overstate what members delivered.
The spread moves less because two forces offset each other. Removing the leavers alone raises it from 1.72 to 3.55 points, as the hypothesis predicts: 43.1% of the cheap quintile later left the index, against 32.3% of the expensive one, and those departing cheap names returned 5.1% in the year after the sort against 18.9% for those that stayed. Only 2.7% of cheap holdings stopped trading within the holding year; most of the drag comes from cheap names that kept trading but lagged. An analysis of stocks removed from the S&P 500 follows prices in the run-up to removal.
Later joiners push the other way. On today’s roster, 32.2% of the expensive quintile were not yet members at the sort, against 25.6% of the cheap one; future additions skew toward expensive stocks on the way up, which lifts Q1 to 18.1%. Net, the survivor list adds 0.96 points to the spread (paired t 0.50).
Four of the six best-known collapses sat in the cheap quintile: Washington Mutual (P/B 0.50) and Bear Stearns (0.81) in 2008, First Republic and SVB Financial in 2023, each losing between 82.9% and 99.7%. Lehman Brothers (fourth quintile) and Enron (second) were not cheap at the sort. None of the six appears in a test built from today’s list. Value won from 2000 to 2012 and lost from 2013 to 2024 on both rosters (+7.47 and −4.50 points point-in-time).
Testing a price-to-book screen on the rosters investors faced
Absolute returns from a current constituent list overstate what a screen would have earned: here about six points a year of them are selection. The spread held up only because two biases cancelled, a balance that depends on the period, the index and the signal.
Build each year’s universe from the roster in force on the sort date, which the historical S&P 500 constituents lookup shows for any past date, and read book equity only from statements filed by then. Split the result by later fate: an edge that rests on names still in the index today is a survivor effect. Among S&P 500 members since 2000, a 1.72-point spread with a t-statistic of 0.47 is not statistically distinguishable from zero.
Built with xfinlink — free financial data API for Python.