
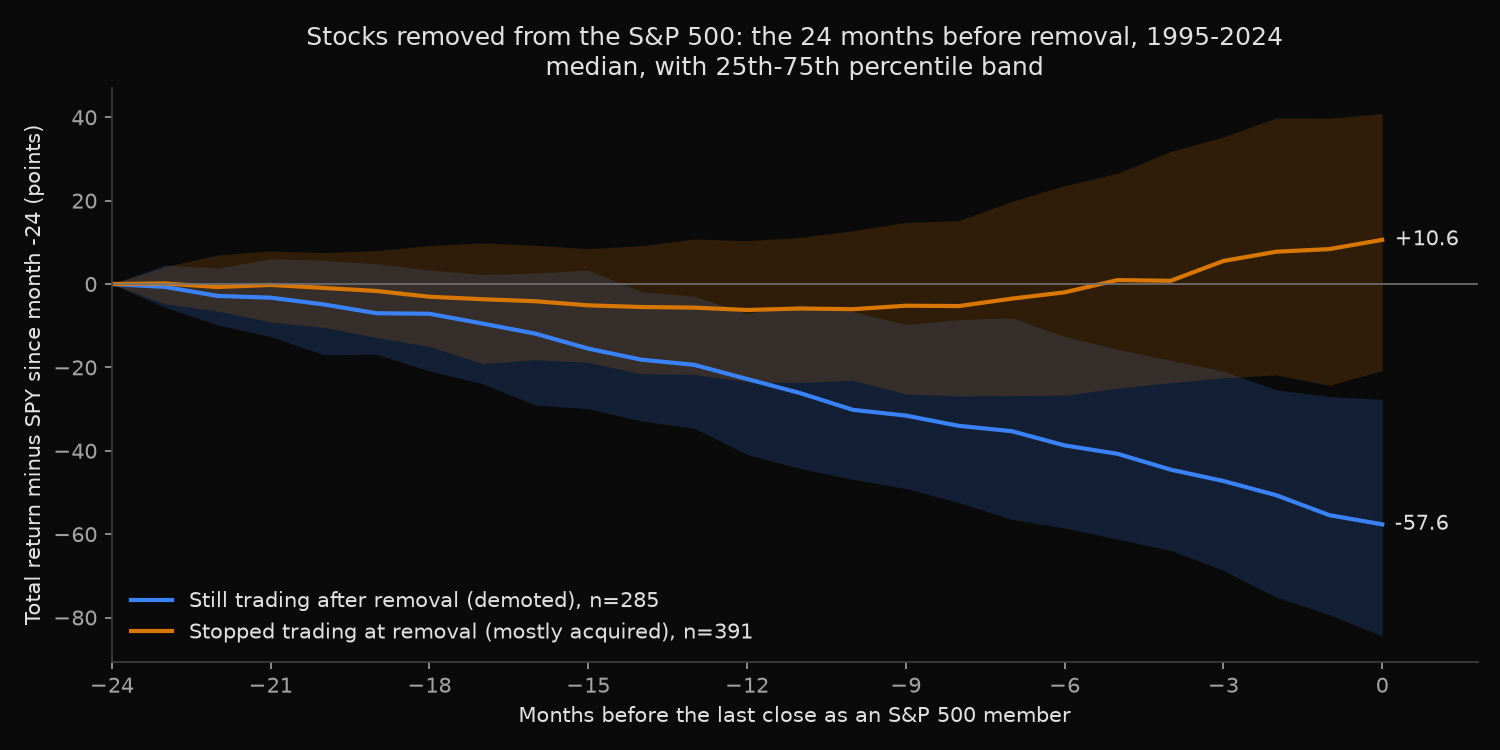
S&P 500 members that were demoted, removed while their shares went on trading, trailed SPY by a median 57.6 percentage points of total return over their last 24 months in the index (285 removals, 1995-2024). Members whose shares stopped trading at removal, mostly acquired companies, finished a median 10.6 points ahead. Only 16 of the 702 removals measured belong to companies in today’s index, so a backtest built from the current list holds almost none of these paths.
How far do stocks fall before the S&P 500 drops them?
A member leaves the S&P 500 either because the company ceases to exist as a listed stock, through an acquisition or a failure, or because it no longer fits the index, usually after its market value has shrunk. Until the removal date every index fund holds it, so whatever it lost on the way out is part of the index return those funds delivered.
The replacement-pair study of S&P 500 deletions covers what removed stocks did after they left. This post looks backwards from the removal date: how large the shortfall is over the two years before it, when it builds up, and whether demoted and acquired companies differ. The measure is the market-adjusted return, a stock’s cumulative total return (price change plus dividends) minus SPY’s over the same trading days, in percentage points.
Following 775 removals back two years by entity id
- Take every removal from the dated log,
xfl.index_events("sp500"), effective 1995 to 2024: 775 removals. The same history appears in the historical S&P 500 constituents lookup; the call is described in the index events reference. - Follow each member by
entity_id, not ticker. AAL was Alexander & Alexander Services when it left the index in 1997 and American Airlines when it left in 2024. - Keep members that had been in the index for the full 504 trading days before removal; 73 recent additions and spin-offs drop out, leaving 702.
- Set month 0 at the last close on or before the removal date, compound the stock’s and SPY’s daily total returns from 504 trading days earlier, and read the gap every 21 trading days.
- Classify each removal from its own price series: at most 5 trading days of prices after the removal (stopped trading, 391), at least 63 (demoted, 285), or in between (26, shown separately). The still-trading group also holds removals made under index rules, such as the seven non-US companies dropped in July 2002.
Code
import pandas as pd
import xfinlink as xfl

xfl.set_api_key("YOUR_API_KEY")  # free at https://xfinlink.com/signup

DAYS, STEP = 504, 21          # 24 months of trading days; one month = 21 trading days

ev = pd.concat([xfl.index_events("sp500", end="2025-06-30", offset=o)
                for o in range(0, 4000, 1000)], ignore_index=True)
ev = ev.dropna(subset=["entity_id"]).drop_duplicates()
ev["eff"] = pd.to_datetime(ev["effective_date"])
ev["entity_id"] = ev["entity_id"].astype(int)
rem = ev[(ev["event_type"] == "removed") & ev["eff"].between("1995-01-01", "2024-12-31")]
adds = ev[ev["event_type"] == "added"]

spy = xfl.prices("SPY", start="1993-01-01", end="2025-06-30", fields=["return_daily"])
spy = spy.set_index("date")["return_daily"].fillna(0.0)
cal = spy.index

# Daily total returns for each year's removed members, followed by entity_id, not ticker
px = {}
for y, g in rem.groupby(rem["eff"].dt.year):
    start = (pd.Timestamp(f"{y}-01-01") - pd.DateOffset(months=26)).date().isoformat()
    end = min(pd.Timestamp(f"{y + 1}-04-30"), pd.Timestamp("2025-06-30")).date().isoformat()
    p = xfl.prices(entity_id=sorted(set(g["entity_id"])), start=start, end=end,
                   fields=["return_daily"], max_rows=250_000)
    for eid, s in p.dropna(subset=["return_daily"]).groupby("entity_id"):
        px[(y, eid)] = s.drop_duplicates("date").set_index("date")["return_daily"]

rows = []
for _, r in rem.iterrows():
    s = px.get((r["eff"].year, r["entity_id"]))
    joined = adds.loc[(adds["entity_id"] == r["entity_id"]) & (adds["eff"] <= r["eff"]), "eff"].max()
    if s is None or (pd.notna(joined) and joined > cal[cal.searchsorted(r["eff"], "right") - 1 - DAYS]):
        rows.append({"group": "member under 24 months"})
        continue
    k0 = cal.get_loc(s.index[s.index <= r["eff"]].max())   # last close as a member = month 0
    window = cal[k0 - DAYS + 1:k0 + 1]
    after = int((s.index > r["eff"]).sum())                # trading days after the removal
    group = ("stopped trading" if after <= 5 else
             "still trading" if after >= 63 else "stopped within 3 months")
    stock = (1 + s.reindex(window).fillna(0.0)).cumprod() - 1
    mkt = (1 + spy.loc[window]).cumprod() - 1
    adj = (stock - mkt).iloc[STEP - 1::STEP].values        # months -23 ... 0
    rows.append({"group": group, "eff": r["eff"], "entity_id": r["entity_id"],
                 "raw": stock.iloc[-1], "spy": mkt.iloc[-1],
                 **{m: v for m, v in zip(range(-23, 1), adj)}, -24: 0.0})

res = pd.DataFrame(rows)
kept = res[res["group"] != "member under 24 months"]
print(res["group"].value_counts())
print((kept.groupby("group")[[-18, -12, -6, -3, -1, 0]].median() * 100).round(1))
Full script with formatting and visualisation: stocks-removed-from-sp500-before-removal-python.py
Output
S&P 500 removals 1995-2024: 775
  member for under 24 months before removal (left out): 73
  stopped trading within 5 trading days of removal:     391
  still trading 63+ trading days after removal:         285
  stopped trading 6-62 trading days after removal:      26
  of the 702 measured, members of today's S&P 500: 16

Return minus SPY's since month -24 (total return, percentage points)
month                        -24    -18    -12     -9     -6     -3     -1      0
still trading   25th pct     0.0  -20.9  -40.9  -49.0  -58.5  -68.7  -79.3  -84.5
still trading   median       0.0   -7.1  -22.8  -31.6  -38.7  -47.2  -55.4  -57.6
still trading   75th pct     0.0    3.3   -7.1   -9.7  -12.6  -20.9  -27.0  -27.7
stopped trading 25th pct     0.0  -15.0  -23.4  -26.3  -26.7  -22.5  -24.3  -20.8
stopped trading median       0.0   -3.1   -6.2   -5.2   -2.0    5.5    8.4   10.6
stopped trading 75th pct     0.0    9.2   10.4   14.8   23.6   35.3   39.8   40.9
stopped within  25th pct     0.0  -21.7  -45.7  -51.3  -62.0  -68.0  -55.7  -65.6
stopped within  median       0.0   -8.1  -13.9  -28.6  -46.3  -39.2  -37.3  -33.4
stopped within  75th pct     0.0    6.4   12.9   -3.1    7.6    2.8    4.6   16.6

still trading (n=285): own return median -33.7%, SPY median +24.0%; behind SPY at month -12 79%, at month 0 91%; mean gap at month 0 -52.9 pts
stopped trading (n=391): own return median +39.7%, SPY median +28.0%; behind SPY at month -12 60%, at month 0 42%; mean gap at month 0 +15.2 pts
stopped within 3 months (n=26): own return median +3.5%, SPY median +30.6%; behind SPY at month -12 69%, at month 0 69%; mean gap at month 0 -24.0 pts
stopped trading with an own 24-month loss beyond 80% (failures and rescues): 15 of 391
still trading: median shortfall reached by month -12 40%, by month -6 67%; median relative wealth (1+stock)/(1+SPY)-1 -46.9%

By period of removal: median gap to SPY at month -12 and month 0 (points)
  1995-2004  still trading    n= 97  month -12  -25.5  month 0  -62.1  behind SPY 84%
  1995-2004  stopped trading  n=162  month -12   -6.1  month 0   +6.5  behind SPY 46%
  2005-2014  still trading    n= 86  month -12  -19.0  month 0  -45.8  behind SPY 90%
  2005-2014  stopped trading  n=131  month -12   -6.2  month 0  +16.0  behind SPY 40%
  2015-2024  still trading    n=102  month -12  -23.9  month 0  -65.1  behind SPY 98%
  2015-2024  stopped trading  n= 98  month -12   -6.1  month 0  +10.5  behind SPY 40%

Still trading, five widest gaps
  1999-06-08  HPH   HARNISCHFEGER INDUSTRIES INC   own  -97.3%  SPY  +57.3%  gap -154.6 pts
  1998-01-16  ECO   ECHO BAY MINES LTD             own  -86.9%  SPY  +62.9%  gap -149.8 pts
  1998-12-31  Z     VENATOR GROUP INC              own  -69.4%  SPY  +71.3%  gap -140.7 pts
  2000-09-29  OWC   OWENS CORNING                  own  -91.3%  SPY  +48.5%  gap -139.8 pts
  1999-09-30  FTL   FRUIT OF THE LOOM INC          own  -87.8%  SPY  +39.9%  gap -127.7 pts
Still trading, three that beat SPY by most
  1995-10-20  FRM   FIRST MISSISSIPPI CORP         own +296.6%  SPY  +32.4%  gap +264.2 pts
  2000-07-27  COMS  3COM CORP                      own +155.4%  SPY  +32.1%  gap +123.3 pts
  2001-08-03  CS    CABLETRON SYSTEMS INC          own  +73.8%  SPY   -5.5%  gap  +79.3 pts
Named checks (AAL appears twice: two different companies)
  2020-04-03  M     MACYS INC                      own  -81.2%  SPY   -2.0%  gap  -79.2 pts
  2020-09-18  KSS   KOHLS CORP                     own  -67.5%  SPY  +18.7%  gap  -86.2 pts
  2013-11-29  JCP   PENNEY J C CO INC              own  -65.7%  SPY  +57.8%  gap -123.6 pts
  2020-04-03  RTN   RAYTHEON CO                    own  -43.2%  SPY   +0.5%  gap  -43.7 pts
  2017-08-28  WFM   WHOLE FOODS MARKET INC         own  +34.3%  SPY  +31.1%  gap   +3.1 pts
  2008-09-16  LEH   LEHMAN BROTHERS HOLDINGS INC   own  -99.6%  SPY   -4.1%  gap  -95.5 pts
  1997-01-14  AAL   ALEXANDER & ALEXANDER SVCS INC own  -14.4%  SPY  +70.8%  gap  -85.2 pts
  2024-09-20  AAL   AMERICAN AIRLINES GROUP INC    own  -22.5%  SPY  +50.6%  gap  -73.1 pts
  M    2020: still trading
  KSS  2020: still trading
  JCP  2013: still trading
  RTN  2020: stopped trading
  WFM  2017: stopped trading
  LEH  2008: stopped trading
  AAL  1997: stopped within 3 months
  AAL  2024: still trading
Demoted members lost most of the ground in their last year
The demoted group’s median path steepens as removal nears: 7.1 points behind SPY at month -18, 22.8 at month -12, 38.7 at month -6 and 57.6 at month 0. About 40% of the final median shortfall had accrued a year before removal and 67% six months before. In plain returns, the median demoted member lost 33.7% while the median SPY return over the same windows was +24.0%; even the 75th percentile ends 27.7 points behind, and 91% trailed.
Several of the widest gaps belong to companies near bankruptcy or in deep restructuring: Harnischfeger (-97.3% before its 1999 removal), Owens Corning, Fruit of the Loom, and J.C. Penney, down 65.7% while SPY gained 57.8%. Macy’s and Kohl’s, both moved out in 2020, trailed by 79.2 and 86.2 points. The few that beat SPY include 3Com, removed in 2000 as it spun off Palm, and Cabletron, removed in 2001 as it split into separate companies.
Companies that stopped trading at removal followed another path. Their median hovered a few points below SPY until month -6 and then climbed to +10.6, consistent with deal premiums entering prices. Failures and rescue takeovers sit in the same group: 15 of 391 lost more than 80%, Lehman Brothers, Washington Mutual, SVB Financial and First Republic among them.
The pattern has not faded. Median demoted shortfalls were 62.1 points for 1995-2004 removals, 45.8 for 2005-2014 and 65.1 for 2015-2024, when 98% of the 102 demoted members trailed SPY.
What the pre-removal slide means for index holders and backtests
These losses happened inside the index, while the names were members. Cap weighting softens them as a falling stock’s weight shrinks; an equal-weight portfolio does not. A universe drawn from today’s constituents drops 686 of the 702 removals and nearly every demoted member’s slide, so its backtest never holds the index’s worst members on their way out. The guide to S&P 500 additions and deletions explains how to rebuild each date’s membership from the dated log.
A year before removal, 79% of eventual demotions already trailed SPY, so a trailing-return screen would have flagged most of them. Its false-alarm rate, the members that trailed as much and stayed, is not measured here and decides whether the screen works. Measure it on each date’s roster before treating weak relative returns as a deletion forecast; acquired companies need a separate test, since their final months run the other way.
Built with xfinlink — free financial data API for Python.