
Stocks removed from the Dow Jones Industrial Average since 1999 did better than the stocks that replaced them in 6 of 10 changes over the following year, and 14 of the 21 removed stocks finished ahead of their change’s additions. Over five years the additions led, 61.2% against 24.3% on average and in 6 of 9 changes, but no horizon’s gap is statistically reliable (signed-rank p from 0.36 to 0.77).
Does the Dow committee swap stocks at the wrong time?
The Dow’s 30 stocks are picked by a committee at S&P Dow Jones Indices, not by a size rule, so each change is a judgement that can be tested: hold what it removed, hold what it added, and compare total returns (price change plus reinvested dividends). If the committee adds companies after their best years and drops them after their worst, mean reversion, the tendency of extreme performance to fade, should favour the deletions. If it spots lasting change, the additions should keep winning.
The removed side cannot be assembled from today’s listings: five of the 21 removed stocks below no longer traded by the end of 2024, Union Carbide, Sears, AT&T Corp, Eastman Kodak and the pre-bankruptcy General Motors.
Twelve committee swaps since 1999
- Read the Dow’s dated event log (
djia, see the index events reference): 56 events from 29 October 1999. Removals are dated on the leaver’s last day. - Set aside three changes where the same company carried on under a new security: J.P. Morgan & Co. merging into Chase, renamed J.P. Morgan Chase on 31 December 2000 (SEC filing), DuPont into DowDuPont (2017) and DowDuPont into Dow Inc (2019). Kraft stays: in 2012 the committee replaced it with UnitedHealth ahead of Kraft’s grocery spin-off (S&P Dow Jones Indices). That leaves 12 swaps.
- From the leaver’s last close, compound daily total returns by
entity_idover 252, 756 and 1,260 trading days, equal-weighted within each side. Windows must end by 31 December 2024; one that does not fit is dropped, leaving 10 changes at one and three years and 9 at five. - A stock that stops trading takes its recorded delisting return, then the proceeds follow DIA, the fund tracking the Dow. General Motors’ exchange listing ended on 1 June 2009 and its common stock was cancelled on 31 March 2011 (FINRA notice), so old GM counts as a total loss from the change date.
- Count wins per change, test the paired returns with a Wilcoxon signed-rank test, and repeat with only removed stocks still trading at the end of 2024.
Rosters on any date are on the historical Dow Jones constituents page. A study of one-for-one S&P 500 swaps pairs leavers with replacements on the larger index, and an event study of Nasdaq-100 changes covers the days around each change.
Code
import numpy as np
import pandas as pd
import xfinlink as xfl
from scipy import stats

xfl.set_api_key("YOUR_API_KEY")  # free at https://xfinlink.com/signup

LAST_DAY = "2024-12-31"
HORIZONS = {"1y": 252, "3y": 756, "5y": 1260}             # trading days
SUCCESSIONS = {"2000-12-29", "2017-08-31", "2019-04-01"}  # same company, new line: no swap

ev = xfl.index_events("djia", start="1999-01-01")
ev["entity_id"] = ev["entity_id"].astype(int)
rem, add = ev[ev["event_type"] == "removed"], ev[ev["event_type"] == "added"]
changes = []
for d, out in rem.groupby("effective_date"):
    if d in SUCCESSIONS or d > LAST_DAY:
        continue
    inn = add[add["effective_date"] == add.loc[add["effective_date"] > d, "effective_date"].min()]
    changes.append({"date": d, "out": list(zip(out["entity_id"], out["ticker"])),
                    "in": list(zip(inn["entity_id"], inn["ticker"]))})

px = xfl.prices(entity_id=sorted(set(ev["entity_id"])), start="1999-10-01", end=LAST_DAY,
                fields=["close", "return_daily"], max_rows=400_000)
R = px.pivot(index="date", columns="entity_id", values="return_daily")
last_bar = px.groupby("entity_id")["date"].max()
dia = xfl.prices("DIA", start="1999-10-01", end=LAST_DAY, fields=["return_daily"]).set_index("date")["return_daily"]
cal = dia.index
delist = {}                                               # exit records of series that end early
for e in last_bar[last_bar < pd.Timestamp(LAST_DAY)].index:
    p = xfl.prices(entity_id=int(e), start=f"{last_bar[e].year}-01-01", end=LAST_DAY, fields=["return_daily"])
    delist.update({int(k): v for k, v in (p.attrs["meta"].get("delisting") or {}).items()})


GM_OLD = 10001629  # old GM: listing ended 2009-06-01, common stock cancelled 2011-03-31


def leg(e, days):
    """Total return; after the last close the delisting return applies, then the proceeds follow DIA."""
    if e == GM_OLD:
        return -1.0                                       # a total loss from the change date
    r = R[e].reindex(days).fillna(0.0)
    if last_bar[e] < days[-1]:
        after = days > last_bar[e]
        r[after] = dia.reindex(days)[after]
        if days[0] <= last_bar[e]:
            dlr = (delist.get(e) or {}).get("delisting_return") or 0.0
            r[days[after][0]] = (1 + r[days[after][0]]) * (1 + dlr) - 1
    return np.prod(1 + r) - 1


rows = []
for c in changes:
    k0 = cal.get_loc(pd.Timestamp(c["date"]))             # base: the leaver's last close in the index
    for h, n in HORIZONS.items():
        if k0 + n >= len(cal):                            # would end after LAST_DAY: dropped
            continue
        days = cal[k0 + 1:k0 + n + 1]
        rows.append({"date": c["date"], "h": h,
                     "removed": np.mean([leg(e, days) for e, _ in c["out"]]),
                     "added": np.mean([leg(e, days) for e, _ in c["in"]])})
res = pd.DataFrame(rows)
res["gap"] = res["added"] - res["removed"]
for h, x in res.groupby("h"):
    print(h, len(x), f"{x['removed'].mean():+.1%} {x['added'].mean():+.1%}",
          f"removed won {(x['gap'] < 0).sum()}", f"p={stats.wilcoxon(x['added'], x['removed']).pvalue:.2f}")
Full script with formatting and visualisation: dow-jones-additions-deletions-performance-python.py
Output
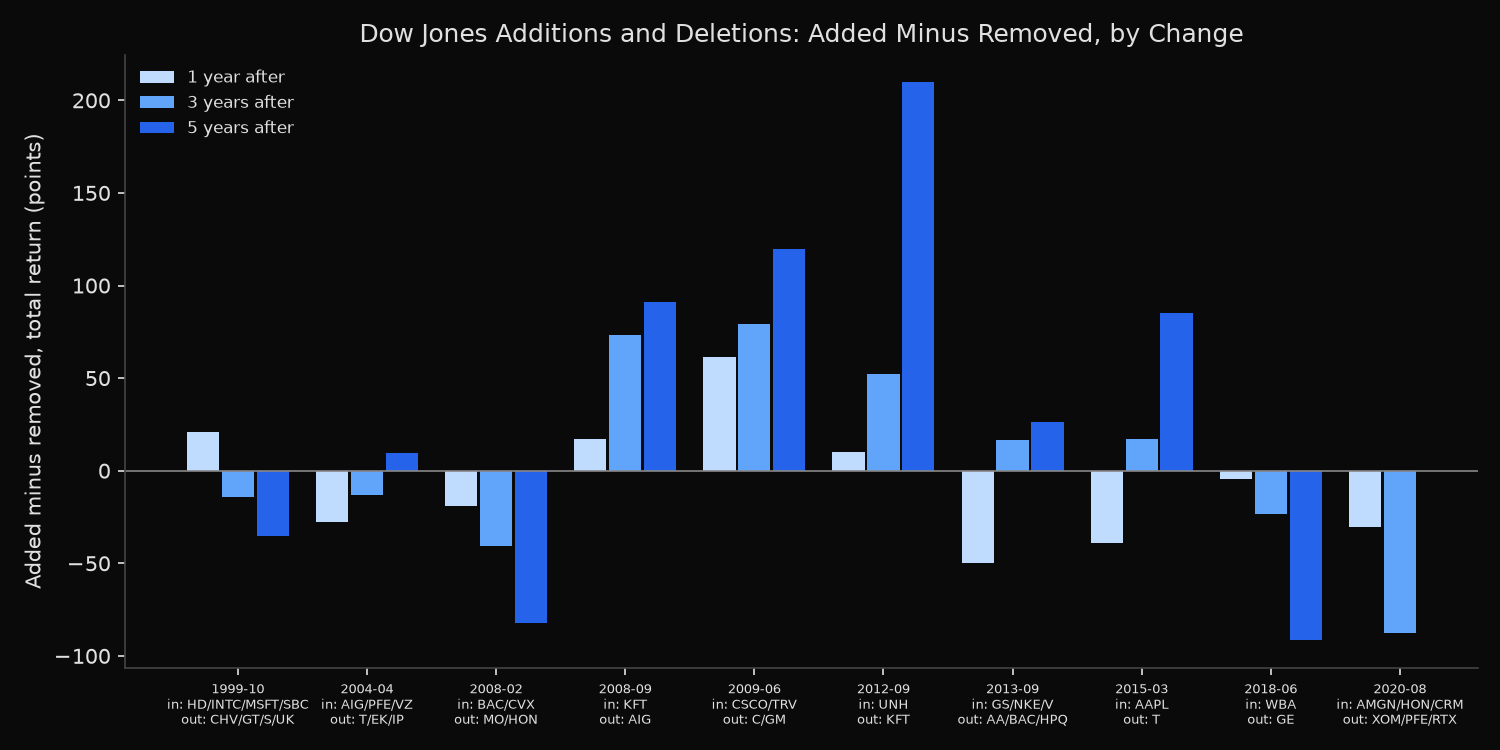
Dow changes since 1999-10-29: 12 swaps (3 corporate successions set aside)

Added minus removed total return, per change (percentage points)
h                                          1y    3y     5y
date       out         in
1999-10-29 CHV/GT/S/UK HD/INTC/MSFT/SBC  +21%  -14%   -35%
2004-04-07 T/EK/IP     AIG/PFE/VZ        -28%  -13%   +10%
2008-02-15 MO/HON      BAC/CVX           -19%  -41%   -82%
2008-09-19 AIG         KFT               +17%  +73%   +91%
2009-06-05 C/GM        CSCO/TRV          +61%  +79%  +120%
2012-09-21 KFT         UNH               +10%  +52%  +210%
2013-09-20 AA/BAC/HPQ  GS/NKE/V          -50%  +17%   +26%
2015-03-18 T           AAPL              -39%  +17%   +85%
2018-06-25 GE          WBA                -5%  -23%   -91%
2020-08-28 XOM/PFE/RTX AMGN/HON/CRM      -30%  -88%

Total return per change (equal weight within each side): mean / median, and how often each side won
1y: n=10  removed  -0.5% /  -3.4%  added  -6.6% / -10.0%  DIA  +3.4%  median gap -11.7%  removed side won 6/10  removed stocks ahead 14/21  Wilcoxon p=0.49
3y: n=10  removed +10.1% / +16.4%  added +16.1% /  +7.5%  DIA +25.7%  median gap  +1.9%  removed side won 5/10  removed stocks ahead 12/21  Wilcoxon p=0.77
5y: n= 9  removed +24.3% / +21.9%  added +61.2% / +67.3%  DIA +50.2%  median gap +26.5%  removed side won 3/9  removed stocks ahead 8/18  Wilcoxon p=0.36

Removed side counting only names still trading at end-2024
1y: n=10  removed (survivors)  +2.2%  added  -6.6%  removed side won 6/10
3y: n=10  removed (survivors) +10.5%  added +16.1%  removed side won 3/10
5y: n= 9  removed (survivors) +27.8%  added +61.2%  removed side won 3/9

Removed stocks whose shares stopped trading inside a window (5-year return; DIA after the exit)
  1999-10-29 UK  last close 2001-02-06  exit merger, delisting return +4.2%  5y -7.8%
  2004-04-07 T   last close 2005-11-18  exit merger, delisting return -0.3%  5y -7.9%
Early wins for the deletions, a few large wins for the additions
The first year favours the removed stocks, though both sides trailed the fund: a mean -0.5% against -6.6% for the additions and 3.4% for DIA. In 2013 Alcoa, Bank of America and Hewlett-Packard gained 93%, 19% and 75% in the year after their exit, while Goldman Sachs, Nike and Visa gained 8% to 18%.
At five years the additions’ mean of 61.2% rests on a few large results, UnitedHealth’s 272% after replacing Kraft and Apple’s 107% among them. Against them stand Bank of America, down 69% after its 2008 entry, and Walgreens Boots Alliance, down 47% while the General Electric it replaced gained 44%. At three years the additions already lead on the mean, 16.1% against 10.1%, while wins stay split 5 of 10.
None of it clears the noise. With nine or ten pairs, p-values of 0.49, 0.77 and 0.36 cannot separate gaps of this size from chance.
Inside the windows, Union Carbide and AT&T Corp left through mergers, at delisting returns of +4.2% and -0.3%. Dropping the five removed stocks no longer trading at the end of 2024 raises the removed side’s mean at every horizon, from 24.3% to 27.8% at five years, but cuts its three-year wins from 5 to 3 of 10: Chevron and Goodyear (down 18% and 80%) then stand alone for 1999, and International Paper (down 5%) for 2004.
Reading a Dow change as a trading signal
A Dow change is not a reliable signal in either direction. The deletions’ one-year lead appears in 6 of 10 changes and 14 of 21 stocks, too thin to trade at p = 0.49.
For research on index changes, build the removed side from the dated event log by entity_id, carry each exit at its delisting return, value a bankrupt name at what its holders received, and keep the names that no longer trade: a removed list limited to today’s listed stocks changes the three-year count of wins.
Built with xfinlink — free financial data API for Python.