
On the S&P 500 roster each month actually had, the fifth of dividend payers with the highest trailing yield returned 11.24% a year from 2000 to 2024, 1.46 points more than all members and 3.31 points more than the stocks that paid nothing. On today’s roster the same fifth roughly matches all members, 0.23 points behind, and trails the non-payers by 6.74. The survivor list reverses the comparison with non-payers because it lifts them by 15.10 points a year, against 5.06 for the high-yield fifth.
Does a survivor roster flatter high-yield stocks?
A high-yield strategy buys the stocks with the largest dividend yield, the cash paid per share over the last twelve months divided by the share price. Its known weakness is the dividend trap: a yield can be high because the price has already collapsed ahead of a dividend cut, an index removal or a bankruptcy. Today’s S&P 500 list has shed many of those companies, so a backtest on it should flatter high yield. The guide to survivorship bias in backtesting sets out the general mechanism; this test also tracks non-payers. The low-volatility backtest on point-in-time and survivor rosters runs the same comparison on another defensive signal.
Ranking each month’s members by trailing dividend yield
- Draw the S&P 500 roster on the last business day of each month from December 1999 to November 2024 with
xfl.index("sp500", as_of=...); each roster sets the next month’s universe. The index membership reference documentsas_of. - Pull monthly bars from December 1998 for the 1,100 securities, keyed by entity id.
- Compute each trailing yield as the past 12 months of dividends, each restated to today’s share basis with its own month’s ratio of adjusted to raw close, over the adjusted month-end price. In the 172 months where a split and a dividend coincide, daily bars supply each ex-date’s own ratio. Special dividends are left out, including the whole amount in the 294 stock-months where a special is reported with another distribution.
- Among members with a full year of monthly bars, group stocks that paid nothing in the past year as non-payers, split the payers into yield quintiles (Q5 highest), and hold each group equally weighted for one month. A holding that stops trading earns its return through its last trading day.
- Repeat with today’s roster as every month’s universe.
Code
import numpy as np
import pandas as pd
import xfinlink as xfl

xfl.set_api_key("YOUR_API_KEY")  # free at https://xfinlink.com/signup

# The S&P 500 roster on the last business day of each month, Dec 1999 to Nov 2024,
# sets the universe for the following month
dates = pd.date_range("1999-12-01", "2024-11-30", freq="BME")
pit = {d.to_period("M") + 1: set(xfl.index("sp500", as_of=d.strftime("%Y-%m-%d"))
                                 .entity_id.dropna().astype(int)) for d in dates}
today = set(xfl.index("sp500").entity_id.dropna().astype(int))

# Monthly bars from December 1998, so the first sort has 12 months of dividends behind it
ids = sorted(set().union(*pit.values()) | today)
px = pd.concat(xfl.prices(entity_id=ids[i:i + 25], start="1998-12-01", end="2024-12-31", interval="1mo",
                          fields=["close", "adj_close", "return_daily", "dividend", "split_ratio"],
                          max_rows=100_000) for i in range(0, len(ids), 25)).reset_index(drop=True)
px["month"] = px["date"].dt.to_period("M")

def restate(rows):
    # Each dividend times adj_close / close on its own row: today's share basis
    factor = rows["adj_close"] / rows["close"]
    special = rows["dividend_type"].fillna("").str.contains("special")
    return pd.DataFrame({"regular": rows["dividend"].where(~special).fillna(0) * factor,
                         "all": rows["dividend"].fillna(0) * factor})

div = restate(px)
# In a month with a split, restate each dividend with the factor of its own ex-date
split = px[(px["split_ratio"].fillna(1) != 1) & px["dividend"].notna()]
for m, g in split.groupby("month"):
    d = xfl.prices(entity_id=g["entity_id"].tolist(), start=str(m.start_time.date()),
                   end=str(m.end_time.date()), fields=["close", "adj_close", "dividend"])
    div.loc[g.index] = restate(d).groupby(d["entity_id"]).sum().reindex(g["entity_id"]).fillna(0).values

ret = px.pivot(index="month", columns="entity_id", values="return_daily").loc["2000-01":]
adj = px.pivot(index="month", columns="entity_id", values="adj_close")
listed = adj.notna().rolling(12).sum() == 12  # a full 12 months of bars at the sort date

def trailing_yield(kind):  # dividends of the last 12 months over the month-end price, known a month ahead
    paid = px.assign(d=div[kind]).pivot(index="month", columns="entity_id", values="d").fillna(0)
    return (paid.rolling(12).sum() / adj).where(listed).shift(1).loc["2000-01":]

print(f"{len(pit)} monthly rosters, {len(ids)} securities, {len(ret)} holding months, "
      f"{len(split)} split months with a dividend restated day by day")

def membership(members):
    return pd.DataFrame([ret.columns.isin(list(members(m))) for m in ret.index],
                        index=ret.index, columns=ret.columns)

pit_mask, today_mask = membership(lambda m: pit[m]), membership(lambda m: today)
annual = lambda r: (1 + r).prod() ** (12 / len(r)) - 1

def backtest(signal, mask, cap=None):
    s, r = signal.where(mask), ret.clip(upper=cap)
    fifth = np.ceil(s.where(s > 0).rank(axis=1, pct=True) * 5)  # 5 = highest yield
    groups = {"Non-payers": s == 0, **{f"Q{k}": fifth == k for k in range(1, 6)}}
    return s, groups, {k: r.where(g).mean(axis=1) for k, g in groups.items()}, r.where(s.notna()).mean(axis=1)

regular = trailing_yield("regular")
for name, mask in {"Point-in-time rosters": pit_mask, "Today's roster": today_mask}.items():
    s, groups, g, market = backtest(regular, mask)
    print(f"{name}: {s.notna().sum(axis=1).mean():.0f} stocks sorted a month on average "
          f"({(s > 0).sum(axis=1).mean():.0f} payers), all members {annual(market):.2%} a year")
    for k, held in groups.items():
        gone = (held & ~today_mask).sum(axis=1).div(held.sum(axis=1)).mean()
        later = (held & ~pit_mask).sum(axis=1).div(held.sum(axis=1)).mean()
        print(f"  {k}: median yield {s.where(held).stack().median():.2%}, return {annual(g[k]):.2%} a year, "
              f"not in today's index {gone:.1%}, not yet a member {later:.1%}")
    spread = g["Q5"] - market
    print(f"  Q5 minus all members: {annual(g['Q5']) - annual(market):+.2%} a year "
          f"(2000-2012 {annual(g['Q5'][:'2012']) - annual(market[:'2012']):+.2%}, "
          f"2013-2024 {annual(g['Q5']['2013':]) - annual(market['2013':]):+.2%}); "
          f"t-stat {spread.mean() / spread.std() * len(spread) ** 0.5:.2f}; "
          f"Q5 minus non-payers: {annual(g['Q5']) - annual(g['Non-payers']):+.2%} a year")

s, groups, _, _ = backtest(regular, pit_mask)
for k in ["Q5", "Non-payers"]:
    print(f"Point-in-time {k} still in the index today: {annual(ret.where(groups[k] & today_mask).mean(axis=1)):.2%} "
          f"a year; since removed: {annual(ret.where(groups[k] & ~today_mask).mean(axis=1)):.2%} a year")
for label, signal, cap in [("Monthly returns capped at +100%", regular, 1.0),
                           ("Special dividends included", trailing_yield("all"), None)]:
    line = []
    for name, mask in {"point-in-time": pit_mask, "today": today_mask}.items():
        _, _, g, market = backtest(signal, mask, cap)
        line.append(f"{name} Q5 minus all {annual(g['Q5']) - annual(market):+.2%}, "
                    f"minus non-payers {annual(g['Q5']) - annual(g['Non-payers']):+.2%}")
    print(f"{label}: " + "; ".join(line))
Full script with formatting and visualisation: dividend-strategy-backtest-survivorship-bias-python.py
Output
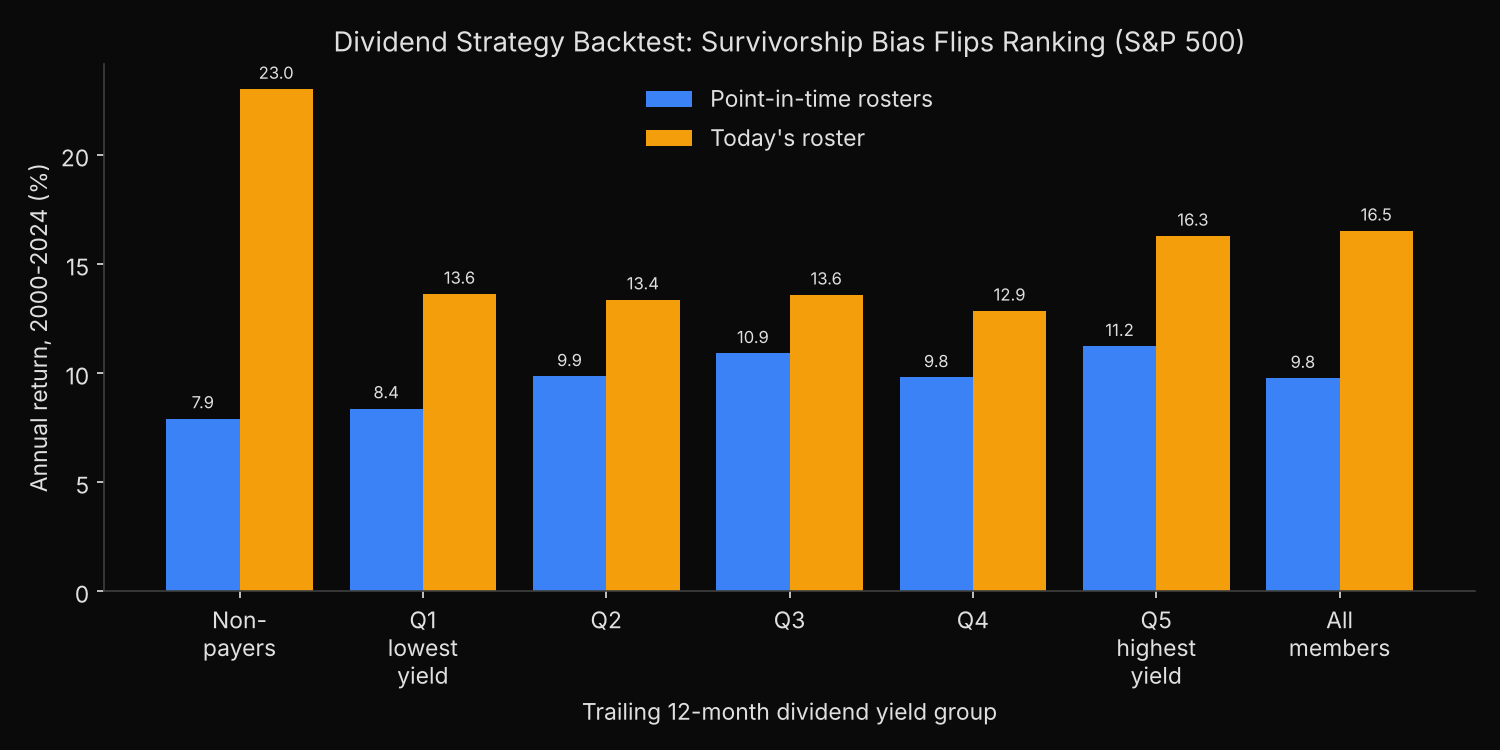
300 monthly rosters, 1100 securities, 300 holding months, 172 split months with a dividend restated day by day
Point-in-time rosters: 499 stocks sorted a month on average (393 payers), all members 9.78% a year
  Non-payers: median yield 0.00%, return 7.93% a year, not in today's index 50.5%, not yet a member 0.0%
  Q1: median yield 0.58%, return 8.39% a year, not in today's index 36.9%, not yet a member 0.0%
  Q2: median yield 1.28%, return 9.86% a year, not in today's index 35.5%, not yet a member 0.0%
  Q3: median yield 1.94%, return 10.92% a year, not in today's index 32.8%, not yet a member 0.0%
  Q4: median yield 2.75%, return 9.81% a year, not in today's index 33.5%, not yet a member 0.0%
  Q5: median yield 4.26%, return 11.24% a year, not in today's index 37.1%, not yet a member 0.0%
  Q5 minus all members: +1.46% a year (2000-2012 +2.15%, 2013-2024 +0.68%); t-stat 0.97; Q5 minus non-payers: +3.31% a year
Today's roster: 419 stocks sorted a month on average (312 payers), all members 16.53% a year
  Non-payers: median yield 0.00%, return 23.03% a year, not in today's index 0.0%, not yet a member 52.7%
  Q1: median yield 0.57%, return 13.64% a year, not in today's index 0.0%, not yet a member 25.5%
  Q2: median yield 1.25%, return 13.38% a year, not in today's index 0.0%, not yet a member 20.8%
  Q3: median yield 1.93%, return 13.60% a year, not in today's index 0.0%, not yet a member 13.2%
  Q4: median yield 2.76%, return 12.86% a year, not in today's index 0.0%, not yet a member 13.4%
  Q5: median yield 4.30%, return 16.30% a year, not in today's index 0.0%, not yet a member 22.7%
  Q5 minus all members: -0.23% a year (2000-2012 +1.12%, 2013-2024 -1.72%); t-stat 0.04; Q5 minus non-payers: -6.74% a year
Point-in-time Q5 still in the index today: 14.71% a year; since removed: 3.94% a year
Point-in-time Non-payers still in the index today: 14.26% a year; since removed: 0.65% a year
Monthly returns capped at +100%: point-in-time Q5 minus all +1.22%, minus non-payers +3.06%; today Q5 minus all -0.28%, minus non-payers -6.53%
Special dividends included: point-in-time Q5 minus all +1.78%, minus non-payers +3.60%; today Q5 minus all +0.42%, minus non-payers -6.05%
Why the survivor list lifts the non-payers
On point-in-time rosters non-payers are the weakest group, at 7.93% a year. The high-yield lead over all members (2.15 points a year in 2000–2012, 0.68 from 2013) is statistically weak, with a t-statistic of 0.97; the 3.31-point gap over non-payers is weaker still, at a t-statistic of 0.75. What is large is the change the roster makes: on today’s list that gap is −6.74 points.
Inside the top fifth the trap is real: in an average month 37.1% of its holdings are companies not in today’s index, and they earned 3.94% a year while held, against 14.71% for those still in it. Frontier Communications spent 144 months there at a median trailing yield of 9.0% and lost 49% over them before its removal in March 2017; Lumen Technologies spent 168 months there at a median 8.1%, lost 72% and left in March 2023.
High yield has no monopoly on failures. The lowest-yield fifth holds almost the same share of later-removed names, 36.9%, while the non-payer group holds 50.5%, and its removed members earned 0.65% a year. The survivor list also adds future members: 52.7% of its non-payers in an average month had not yet joined the index, against 22.7% of its high-yield fifth.
Neither extreme months nor the special-dividend rule drives the reversal. Capping each holding-month return at +100% leaves the gap over non-payers at +3.06 points on point-in-time rosters and −6.53 on today’s; counting special dividends gives +3.60 and −6.05.
Backtesting an income strategy on dated rosters
Measured against non-payers, a backtest on today’s constituents is biased against income investing: it drops the high-yield traps but drops more failed non-payers and adds future members, so a yield screen that beat non-payers by 3.31 points a year at the time trails them by 6.74, though it still leads the other payer quintiles. Test a yield rule on the roster in force at each rebalance; the S&P 500 members on any past date supply those rosters, also available through as_of in code.
The trap still matters for stock selection: only a dated roster keeps the removed high-yielders in the test, so only it can test whether a dividend-safety screen avoids them. The study of S&P 500 deletions and their replacements follows the companies that leave the index and the ones that take their places.
Built with xfinlink — free financial data API for Python.